. 2024 Feb 28;16(5):691.
doi: 10.3390/nu16050691.

microRNA Expression Profile in Obesity-Induced Kidney Disease Driven by High-Fat Diet in Mice

Affiliations

microRNA Expression Profile in Obesity-Induced Kidney Disease Driven by High-Fat Diet in Mice

Àuria Eritja et al. Nutrients. .

Abstract

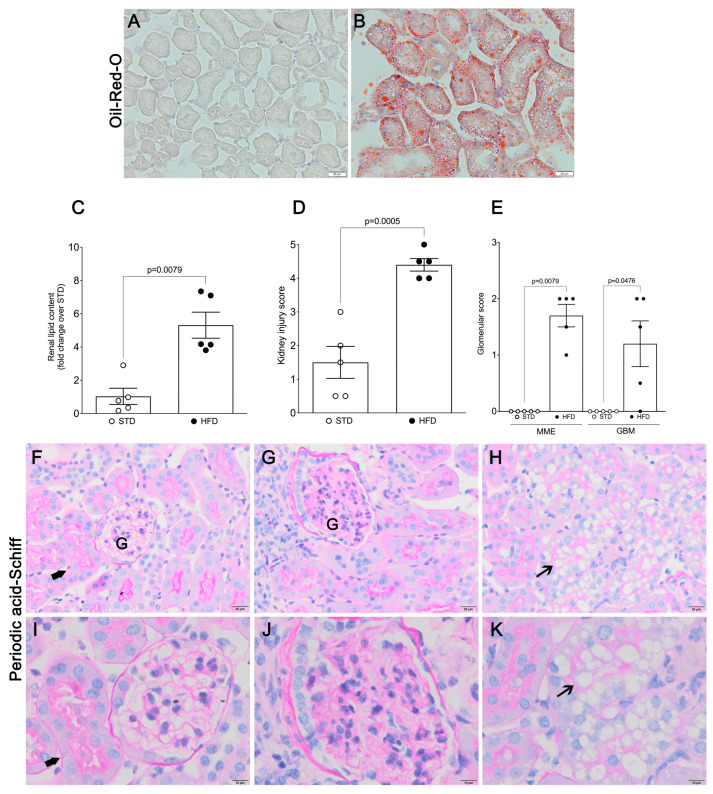
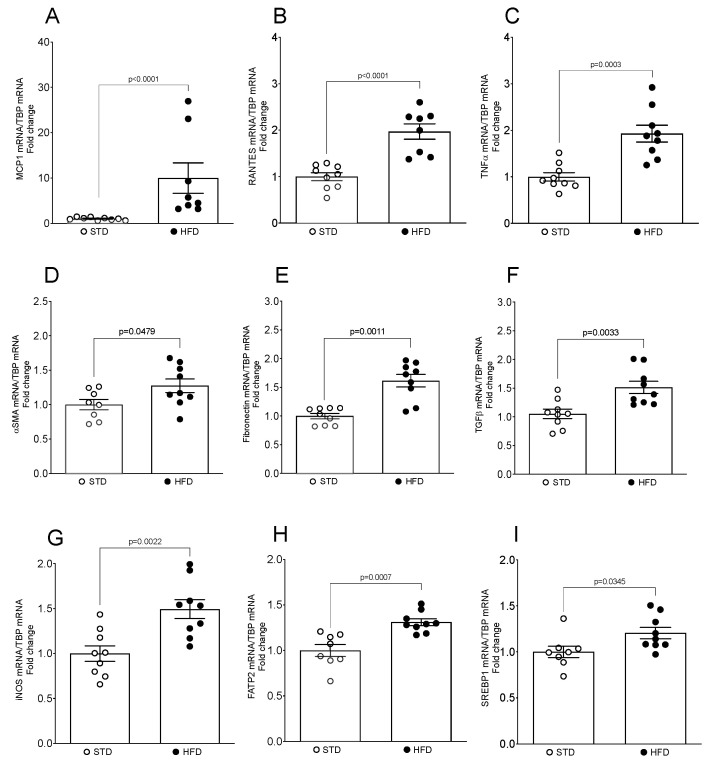
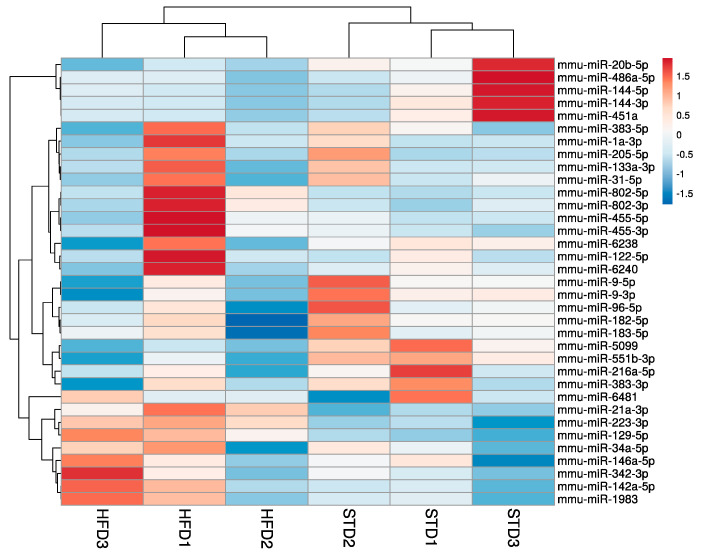
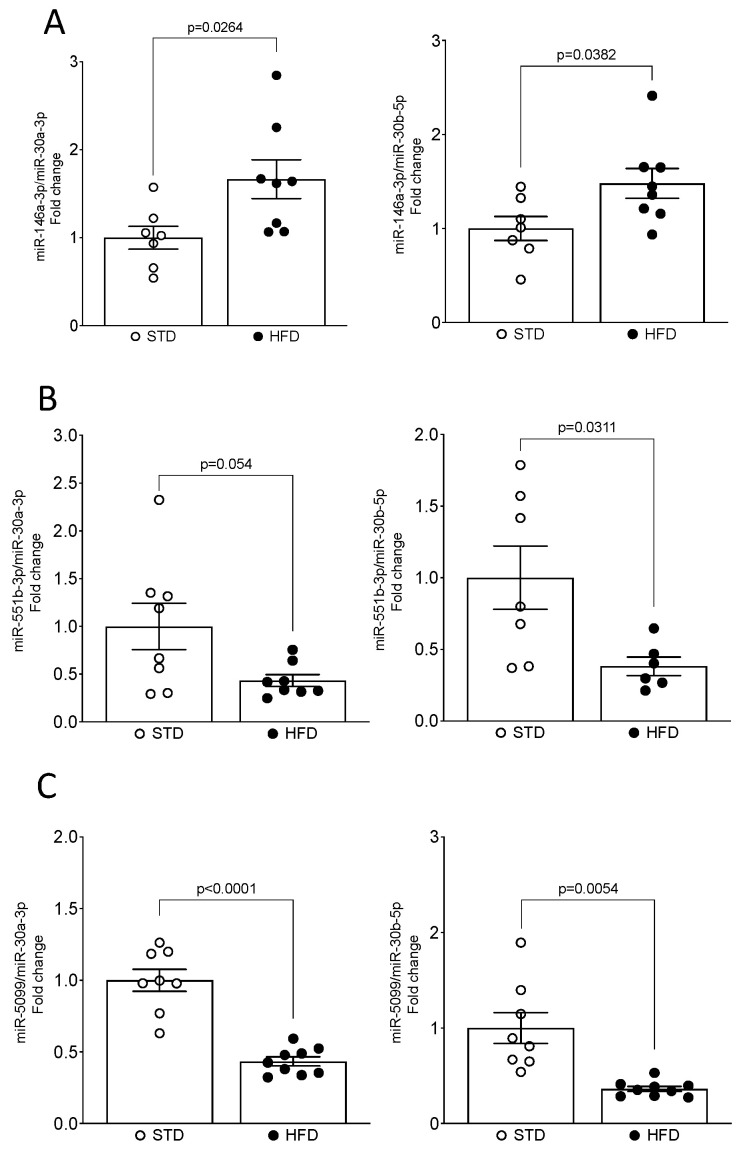
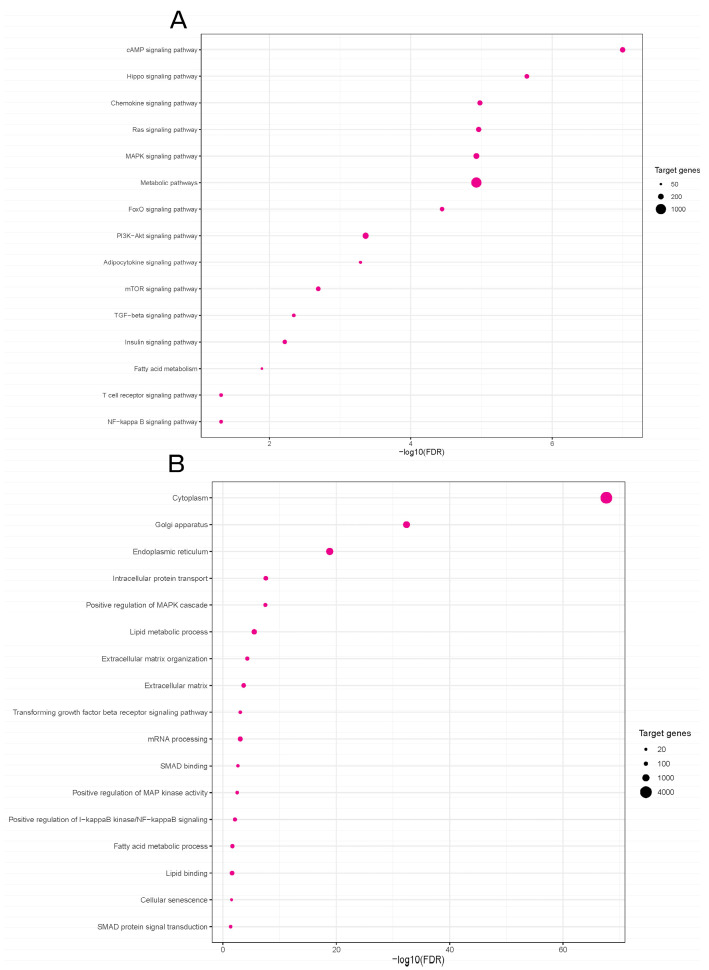
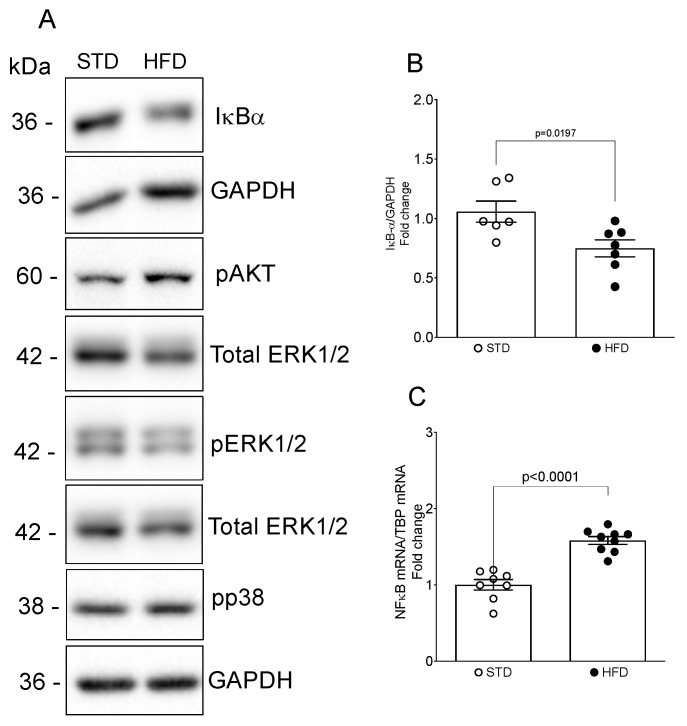
Obesity is one of the main causes of chronic kidney disease; however, the precise molecular mechanisms leading to the onset of kidney injury and dysfunction in obesity-associated nephropathy remain unclear. The present study aimed to unveil the kidney microRNA (miRNA) expression profile in a model of obesity-induced kidney disease in C57BL/6J mice using next-generation sequencing (NGS) analysis. High-fat diet (HFD)-induced obesity led to notable structural alterations in tubular and glomerular regions of the kidney, increased renal expression of proinflammatory and profibrotic genes, as well as an elevated renal expression of genes involved in cellular lipid metabolism. The miRNA sequencing analysis identified a set of nine miRNAs differentially expressed in the kidney upon HFD feeding, with miR-5099, miR-551b-3p, miR-223-3p, miR-146a-3p and miR-21a-3p showing the most significant differential expression between standard diet (STD) and HFD mice. A validation analysis showed that the expression levels of miR-5099, miR-551b-3p and miR-146a-3p were consistent with NGS results, while Kyoto Encyclopedia of Genes and Genomes (KEGG) and Gene Ontology (GO) enrichment analyses revealed that these three validated miRNAs modulated target genes involved in metabolic and adipocytokine pathways, fatty acid and lipid metabolism, and inflammatory, senescence and profibrotic pathways. Our results suggest that differentially expressed miRNAs play pivotal roles in the intricate pathophysiology of obesity-associated kidney disease and could potentially create novel treatment strategies to counteract the deleterious effects of obesity on kidney function.

Keywords: chronic kidney disease; high-fat diet; kidney; lipotoxicity; miRNA; miRNA-seq; next-generation sequencing; obesity; obesity-induced kidney disease.


Conflict of interest statement

The authors declare no conflicts of interest.

Figures

Figure 1
Figure 1
Histological assessment of tubular and glomerular changes upon HFD feeding. Representative photomicrographs of Oil Red O (A,B) and periodic acid-Schiff staining (PAS) (FK) of frozen (A,B) and paraffin-embedded (FK) kidney sections from mice fed an STD (A,F,I) and an HFD (B,G,H,J,K). Thick arrows, healthy renal tubule; thin arrows, vacuolization of tubular cells; (A,B,FH) scale bar represents 20 μm, (IK) scale bar represents 10 μm. (C) Quantification of renal lipid content (Oil Red O). (D) Kidney injury score. (E) Histopathological assessment of glomerular parameters. Data present the mean ± SEM of 5 mice/group. Three tissue sections per animal were analyzed. MME, mesangial matrix expansion; GBM, glomerular basement membrane thickness; G: Glomerulus.
Figure 2
Figure 2
Expression levels of obesity-related genes and inflammatory and profibrotic markers in the mouse kidney upon HFD feeding. (AI) Total mRNA was isolated from kidneys and mRNA levels for specific genes were assessed by real-time qPCR. The relative mRNA levels were calculated and expressed as fold change over STD (value = 1.0) after normalizing for TBP. Data are presented as mean ± SEM (n = 8–9 mice/group).
Figure 3
Figure 3
Hierarchical clustering of most variable miRNAs in a mouse model of OIKD. The heatmap was generated by the unsupervised hierarchical clustering of the miRNA profiles of 3 STD- and 3 HFD-fed mice. A variance-stabilized transformation was carried out on the raw count matrix, and hierarchical clustering was performed on the top 35 genes with the highest variance across samples. Each row in the matrix corresponds to an individual gene, while each column corresponds to a distinct sample. Rows are centered; unit variance scaling is applied to rows. Both rows and columns are clustered using correlation distance and average linkage.
Figure 4
Figure 4
qPCR validation confirmed modulation of miR-5099, miR-551b-3p and miR-146a-3p in the mouse kidney upon HFD feeding. (AC) miRNAs levels were determined by real-time qPCR and expressed as fold change over STD (value = 1.0) after normalizing for both miR-30a-3p and miR-30b-5p, as endogenous controls. Data are presented as mean ± SEM (n = 7–9 mice/group).
Figure 5
Figure 5
Kyoto Encyclopedia of Genes and Genomes (KEGG) and Gene Ontology (GO) analyses of the predicted miRNA target genes in a mouse model of OIKD. (A) KEGG biological pathway analysis (selected). (B) GO functional enrichment analysis for biological processes (selected). The p-value represents the significance of the biological process and molecular pathway. The size of the points represents the number of genes involved in the process or pathway. The false discovery rate (FDR)-adjusted p-value cutoff was 0.05.
Figure 6
Figure 6
Evaluation of NFκB, PI3K-Akt and MAPK pathway activation in the mouse kidney upon HFD feeding. Whole kidney lysates underwent protein analysis and were immunoblotted with antibodies against pAkt, pERK1/2, p-p38, Iκ-Bα, total ERK1/2 and GAPDH. (A) Representative Western blots. (B) Quantitative densitometric analysis. Data were normalized to GAPDH and presented as mean ± SEM (n = 6–7 mice/group) (fold change over STD). (C) mRNAs levels for NFκB p50 were determined by real-time qPCR and expressed as fold change over STD (value = 1.0) after normalizing for TBP. Data are presented as mean ± SEM (n = 8–9 mice/group).

References

    1. Brown J.C., Carson T.L., Thompson H.J., Agurs-Collins T. The Triple Health Threat of Diabetes, Obesity, and Cancer—Epidemiology, Disparities, Mechanisms, and Interventions. Obesity. 2021;29:954–959. doi: 10.1002/oby.23161. - DOI - PMC - PubMed
    1. Di Angelantonio E., Bhupathiraju S.N., Wormser D., Gao P., Kaptoge S., de Gonzalez A.B., Cairns B.J., Huxley R., Jackson C.L., Joshy G., et al. Body-mass index and all-cause mortality: Individual-participant-data meta-analysis of 239 prospective studies in four continents. Lancet. 2016;388:776–786. doi: 10.1016/S0140-6736(16)30175-1. - DOI - PMC - PubMed
    1. Burki T. European Commission classifies obesity as a chronic disease. Lancet Diabetes Endocrinol. 2021;9:418. doi: 10.1016/S2213-8587(21)00145-5. - DOI - PubMed
    1. Ejerblad E., Fored C.M., Lindblad P., Fryzek J., McLaughlin J.K., Nyrén O. Obesity and Risk for Chronic Renal Failure. J. Am. Soc. Nephrol. 2006;17:1695–1702. doi: 10.1681/ASN.2005060638. - DOI - PubMed
    1. Hsu C.-Y., McCulloch C.E., Iribarren C., Darbinian J., Go A.S. Body Mass Index and Risk for End-Stage Renal Disease. Ann. Intern. Med. 2006;144:21–28. doi: 10.7326/0003-4819-144-1-200601030-00006. - DOI - PubMed