. 2024 Feb 29;16(5):696.
doi: 10.3390/nu16050696.

The Effect of Micronutrients on Obese Phenotype of Adult Mice Is Dependent on the Experimental Environment

Affiliations

The Effect of Micronutrients on Obese Phenotype of Adult Mice Is Dependent on the Experimental Environment

Zeyu Yang et al. Nutrients. .

Abstract

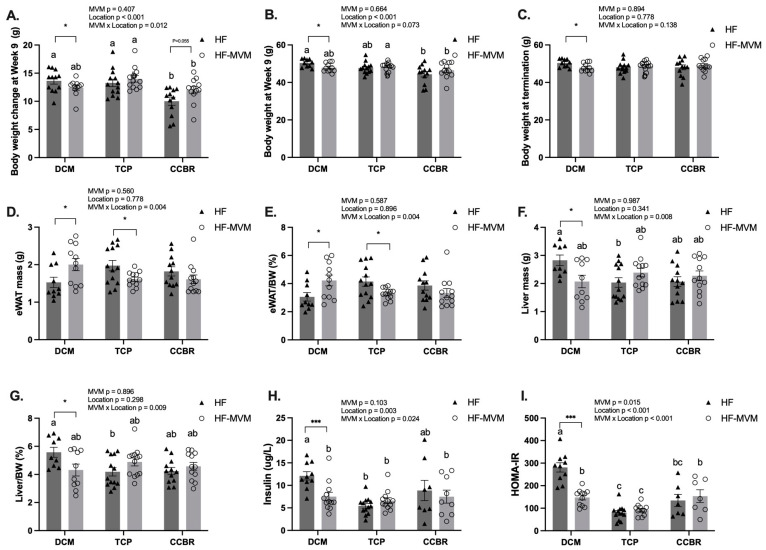
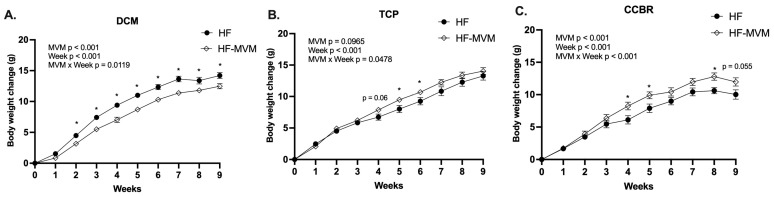
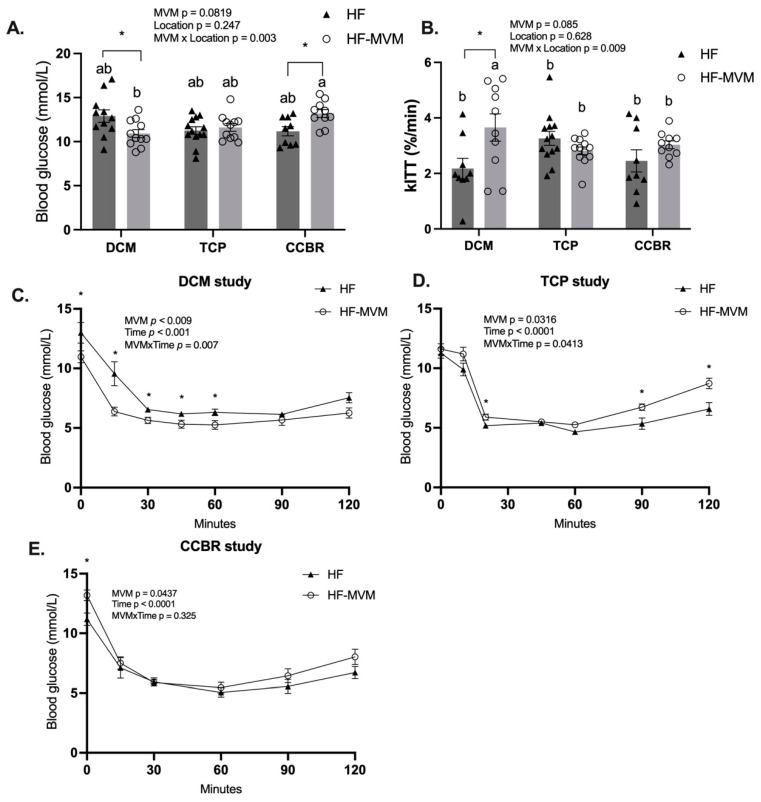
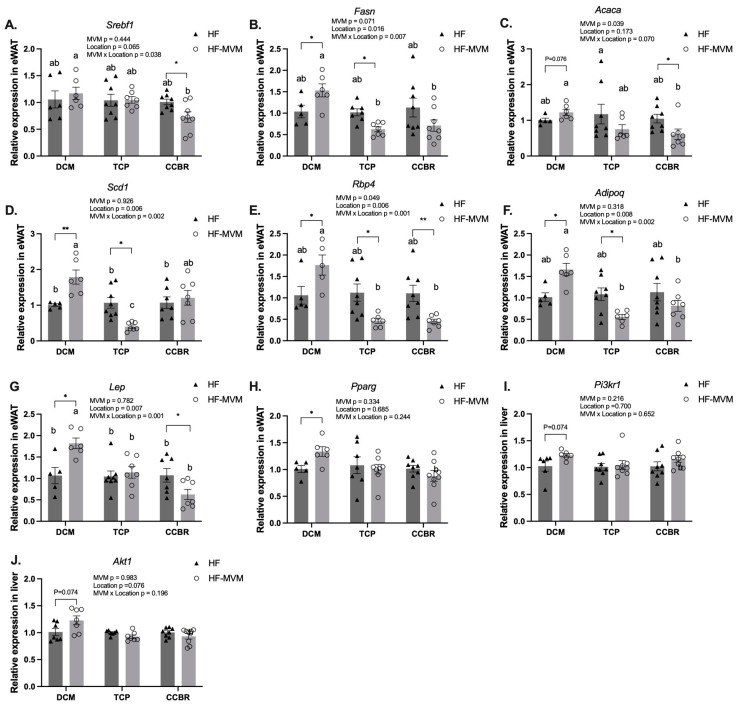
The environment of the test laboratory affects the reproducibility of treatment effects on physiological phenotypes of rodents and may be attributed to the plasticity of the epigenome due to nutrient-gene-environment interactions. Here, we explored the reproducibility of adding a multi-vitamin-mineral (MVM) mix to a nutrient-balanced high-fat (HF) diet on obesity, insulin resistance (IR), and gene expression in the tissues of adult male mice. Experiments of the same design were conducted in three independent animal facilities. Adult C57BL/6J male mice were fed an HF diet for 6 weeks (diet induced-obesity model) and then continued for 9-12 weeks on the HF diet with or without 5-fold additions of vitamins A, B1, B6, B12, Zn, and 2-fold Se. The addition of the MVM affected body weight, fat mass, gene expression, and markers of IR in all three locations (p < 0.05). However, the direction of the main effects was influenced by the interaction with the experimental location and its associated environmental conditions known to affect the epigenome. In conclusion, MVM supplementation influenced phenotypes and expression of genes related to adipose function in obese adult male mice, but the experimental location and its associated conditions were significant interacting factors. Preclinical studies investigating the relationship between diet and metabolic outcomes should acknowledge the plasticity of the epigenome and implement measures to reproduce studies in different locations.

Keywords: diet; experimental environment; gene expression; insulin resistance; micronutrients; obesity.


Conflict of interest statement

The authors declare no conflicts of interest.

Figures

Figure 1
Figure 1
Phenotypical measures in three experiments. Body weight change at Week 9 (A), body weight at Week 9 (B) and at termination in each study (C), eWAT mass (D) and percentage to body weight (E), liver mass (F) and percentage to body weight (G), fasting insulin levels (H) and HOMA-IR (I) across the three studies. Values are Mean ± SEM, n = 9–12 for DCM and CCBR, and 12–15 in TCP. A two-way ANOVA was conducted with Location (DCM, TCP, and CCBR) and MVM (HF or HF-MVM) as main factors and an MVM × Location interaction term. A Tukey’s post hoc analysis adjusted for multiple comparisons followed all significant interactions. abc Significantly different at p < 0.05 using Tukey’s post hoc analysis. A t-test was used to compare HF and HF-MVM within each location. Significant differences (p < 0.05) are indicated by an asterisk (*). * p < 0.05, *** p < 0.001.
Figure 2
Figure 2
Body weight gain over time from week 1 to week 9 of the dietary intervention until termination in Location DCM (A), TCP (B), and CCBR (C). Values are Mean ± SEM, n = 9–12 for DCM and CCBR, and 12–15 in TCP. A two-way analysis of variance (ANOVA) was conducted by PROC MIXED procedure with MVM (non-MVM vs. MVM) and Week as main factors and an MVM × Week interaction term followed by Tukey’s post hoc test on body weight gain. Significant differences (p < 0.05) are indicated by an asterisk (*). * p < 0.05.
Figure 3
Figure 3
Insulin tolerance test. The fasting glucose level before insulin injection across three experiments (A); the glucose disappearance rate (kITT) from 0–15 min for DCM and CCBR, and 0–20 min after insulin injection across the three experiments (B); glucose levels after intraperitoneal injection of insulin from 0 to 120 min in DCM (C), TCP (D), and CCBR (E). Values are Mean ± SEM, n = 9–12 for DCM and CCBR, and n = 12–15 in TCP. A two-way analysis of variance (ANOVA) was conducted by PROC MIXED procedure with MVM (non-MVM vs. MVM) and time as main factors and an MVM*Time interaction term followed by Tukey’s post hoc test on ITT. A two-way ANOVA was conducted with dietary MVM and Location as main factors and an MVM × Location interaction term on fasting glucose and kITT by Tukey’s post hoc test. ab Significantly different at p < 0.05. * p < 0.05.
Figure 4
Figure 4
Relative mRNA expression of genes involved in lipogenesis (AD), adipokine synthesis (EG), and adipogenesis (H) in the eWAT, and insulin signaling (I,J) in the liver of mice in three experiments. Values are Mean ± SEM, n = 5–8/group. A two-way ANOVA was conducted with MVM (HF or HF-MVM) and Location (DCM, TCP, and CCBR) as the main factors and an MVM*Location interaction term. A Tukey’s post hoc analysis adjusted for multiple comparisons followed all significant interactions. abc Significantly different at p < 0.05 by Tukey’s post hoc analysis. A t-test was used to compare HF and HF-MVM within each location. Significant differences (p < 0.05) are indicated by an asterisk (*). * p < 0.05, ** p < 0.01.

References

    1. Freedman L.P., Cockburn I.M., Simcoe T.S. The Economics of Reproducibility in Preclinical Research. PLoS Biol. 2015;13:e1002165. doi: 10.1371/journal.pbio.1002165. - DOI - PMC - PubMed
    1. Begley C.G., Ioannidis J.P.A. Reproducibility in Science: Improving the Standard for Basic and Preclinical Research. Circ. Res. 2015;116:116–126. doi: 10.1161/CIRCRESAHA.114.303819. - DOI - PubMed
    1. Voelkl B., Altman N.S., Forsman A., Forstmeier W., Gurevitch J., Jaric I., Karp N.A., Kas M.J., Schielzeth H., Van de Casteele T., et al. Reproducibility of Animal Research in Light of Biological Variation. Nat. Rev. Neurosci. 2020;21:384–393. doi: 10.1038/s41583-020-0313-3. - DOI - PubMed
    1. Jaric I., Voelkl B., Clerc M., Schmid M.W., Novak J., Rosso M., Rufener R., von Kortzfleisch V.T., Richter S.H., Buettner M., et al. The Rearing Environment Persistently Modulates Mouse Phenotypes from the Molecular to the Behavioural Level. PLoS Biol. 2022;20:e3001837. doi: 10.1371/journal.pbio.3001837. - DOI - PMC - PubMed
    1. Ueno H., Takahashi Y., Mori S., Murakami S., Wani K., Matsumoto Y., Okamoto M., Ishihara T. Mice Recognise Mice in Neighbouring Rearing Cages and Change Their Social Behaviour. Behav. Neurol. 2024;2024:9215607. doi: 10.1155/2024/9215607. - DOI - PMC - PubMed