

Estimating the Heavy Metal Contents in Entisols from a Mining Area Based on Improved Spectral Indices and Catboost
- PMID: 38475028
- PMCID: PMC10934176
- DOI: 10.3390/s24051492
Estimating the Heavy Metal Contents in Entisols from a Mining Area Based on Improved Spectral Indices and Catboost
Abstract
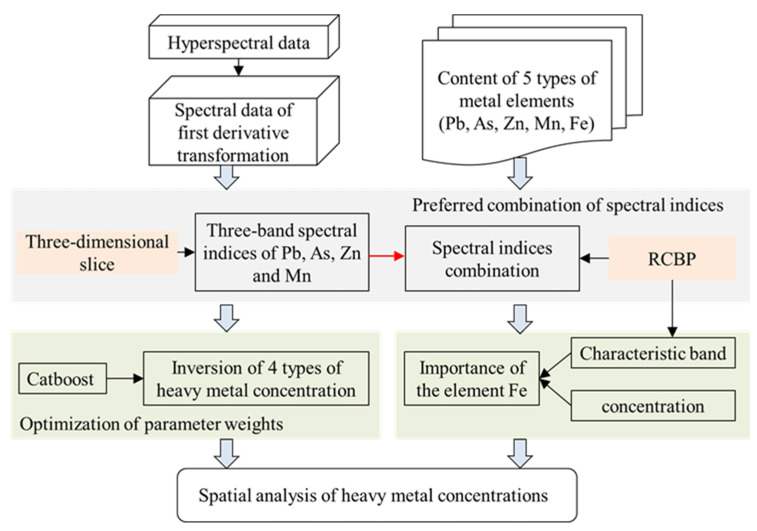
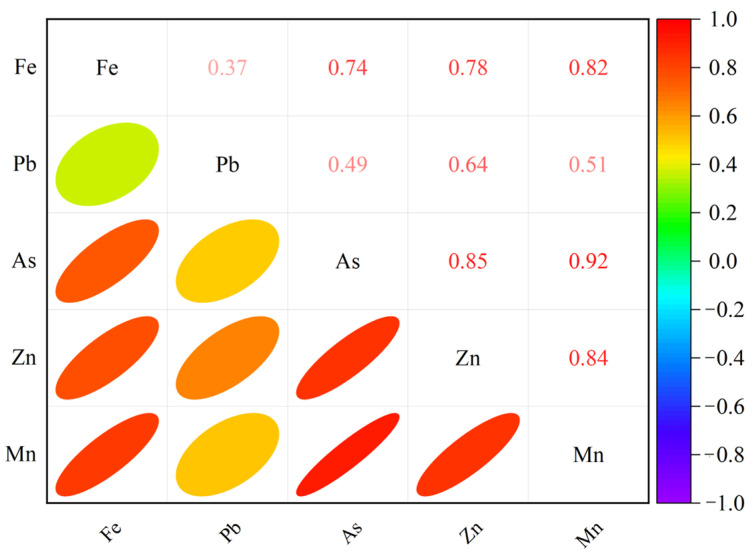
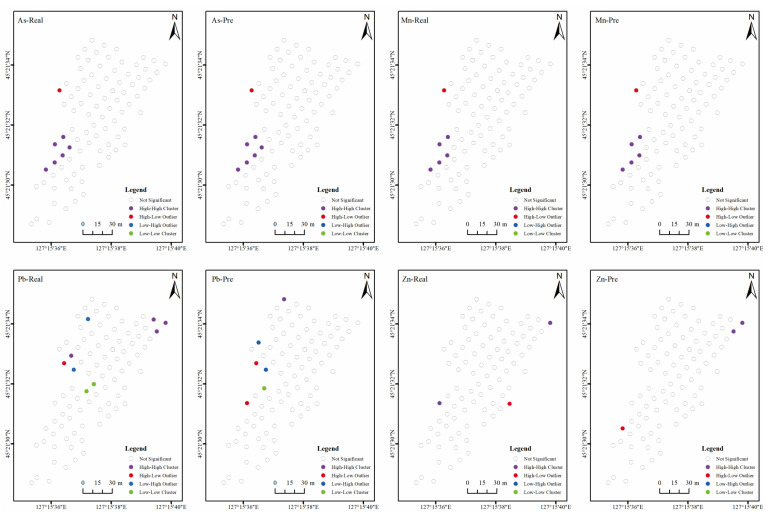
In the study of the inversion of soil multi-species heavy metal element concentrations using hyperspectral techniques, the selection of feature bands is very important. However, interactions among soil elements can lead to redundancy and instability of spectral features. In this study, heavy metal elements (Pb, Zn, Mn, and As) in entisols around a mining area in Harbin, Heilongjiang Province, China, were studied. To optimise the combination of spectral indices and their weights, radar plots of characteristic-band Pearson coefficients (RCBP) were used to screen three-band spectral index combinations of Pb, Zn, Mn, and As elements, while the Catboost algorithm was used to invert the concentrations of each element. The correlations of Fe with the four heavy metals were analysed from both concentration and characteristic band perspectives, while the effect of spectral inversion was further evaluated via spatial analysis. It was found that the regression model for the inversion of the Zn elemental concentration based on the optimised spectral index combinations had the best fit, with R2 = 0.8786 for the test set, followed by Mn (R2 = 0.8576), As (R2 = 0.7916), and Pb (R2 = 0.6022). As far as the characteristic bands are concerned, the best correlations of Fe with the Pb, Zn, Mn and As elements were 0.837, 0.711, 0.542 and 0.303, respectively. The spatial distribution and correlation of the spectral inversion concentrations of the As and Mn elements with the measured concentrations were consistent, and there were some differences in the results for Zn and Pb. Therefore, hyperspectral techniques and analysis of Fe elements have potential applications in the inversion of entisols heavy metal concentrations and can improve the quality monitoring efficiency of these soils.
Keywords: Catboost; entisols; heavy metals; hyperspectral remote sensing; spectral index.
Conflict of interest statement
The authors declare no conflicts of interest.
Figures


Similar articles
-
Hyperspectral indirect inversion of heavy-metal copper in reclaimed soil of iron ore area.Spectrochim Acta A Mol Biomol Spectrosc. 2019 Nov 5;222:117191. doi: 10.1016/j.saa.2019.117191. Epub 2019 Jun 6. Spectrochim Acta A Mol Biomol Spectrosc. 2019. PMID: 31247388 Review.
-
[Spatial Distribution and Sources of Heavy Metals in Soil of a Typical Lead-Zinc Mining Area, Yangshuo].Huan Jing Ke Xue. 2022 Oct 8;43(10):4545-4555. doi: 10.13227/j.hjkx.202201127. Huan Jing Ke Xue. 2022. PMID: 36224140 Chinese.
-
[Estimating heavy metal concentrations in topsoil from vegetation reflectance spectra of Hyperion images: A case study of Yushu County, Qinghai, China.].Ying Yong Sheng Tai Xue Bao. 2016 Jun;27(6):1775-1784. doi: 10.13287/j.1001-9332.201606.030. Ying Yong Sheng Tai Xue Bao. 2016. PMID: 29737683 Chinese.
-
Interactions between heavy metals and other mineral elements from soil to medicinal plant Fengdan (Paeonia ostii) in a copper mining area, China.Environ Sci Pollut Res Int. 2020 Sep;27(27):33743-33752. doi: 10.1007/s11356-020-09358-z. Epub 2020 Jun 13. Environ Sci Pollut Res Int. 2020. PMID: 32533491
-
Development of a soil heavy metal estimation method based on a spectral index: Combining fractional-order derivative pretreatment and the absorption mechanism.Sci Total Environ. 2022 Mar 20;813:151882. doi: 10.1016/j.scitotenv.2021.151882. Epub 2021 Nov 23. Sci Total Environ. 2022. PMID: 34822891
Cited by
-
Heavy Metal Concentration Estimation for Different Farmland Soils Based on Projection Pursuit and LightGBM with Hyperspectral Images.Sensors (Basel). 2024 May 20;24(10):3251. doi: 10.3390/s24103251. Sensors (Basel). 2024. PMID: 38794105 Free PMC article.
-
A Rapid Intelligent Screening of a Three-Band Index for Estimating Soil Copper Content.Molecules. 2025 Jul 31;30(15):3215. doi: 10.3390/molecules30153215. Molecules. 2025. PMID: 40807389 Free PMC article.
References
-
- Dai C., Liu Y., Wang T., Li Z., Zhou Y., Deng J. Quantifying the structural characteristics and hydraulic properties of shallow Entisol in a hilly landscape. Int. Agrophys. 2022;36:105–113. doi: 10.31545/intagr/148029. - DOI
-
- Hu B., Shao S., Ni H., Fu Z., Hu L., Zhou Y., Min X., She S., Chen S., Huang M., et al. Current status, spatial features, health risks, and potential driving factors of soil heavy metal pollution in China at province level. Environ. Pollut. 2020;266:114961. doi: 10.1016/j.envpol.2020.114961. - DOI - PubMed
-
- Benedet L., Silva S.H.G., Mancini M., dos Santos Teixeira A.F., Inda A.V., Demattê J.A., Curi N. Variation of properties of two contrasting Oxisols enhanced by pXRF and Vis-NIR. J. S. Am. Earth Sci. 2022;115:103748. doi: 10.1016/j.jsames.2022.103748. - DOI
-
- Yang H., Xu H., Zhong X. Prediction of soil heavy metal concentrations in copper tailings area using hyperspectral reflectance. Environ. Earth Sci. 2022;81:183. doi: 10.1007/s12665-022-10307-x. - DOI
Grants and funding
- 42101388/National Natural Science Foundation of China
- 0031504/Shandong Top Talent Special Foundation
- ZR2022MD070/Shandong Provincial Natural Science Foundation, China
- 2022KJ201/Youth Innovation Team Project of Higher School in Shandong Province
- 2018YFE0204200/the National Key Research and Development Program of China
LinkOut - more resources
Full Text Sources
Research Materials
