Accurate Localization of First and Second Heart Sounds via Template Matching in Forcecardiography Signals
- PMID: 38475062
- PMCID: PMC10934607
- DOI: 10.3390/s24051525
Accurate Localization of First and Second Heart Sounds via Template Matching in Forcecardiography Signals
Abstract
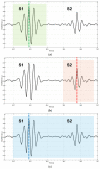
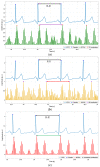
Cardiac auscultation is an essential part of physical examination and plays a key role in the early diagnosis of many cardiovascular diseases. The analysis of phonocardiography (PCG) recordings is generally based on the recognition of the main heart sounds, i.e., S1 and S2, which is not a trivial task. This study proposes a method for an accurate recognition and localization of heart sounds in Forcecardiography (FCG) recordings. FCG is a novel technique able to measure subsonic vibrations and sounds via small force sensors placed onto a subject's thorax, allowing continuous cardio-respiratory monitoring. In this study, a template-matching technique based on normalized cross-correlation was used to automatically recognize heart sounds in FCG signals recorded from six healthy subjects at rest. Distinct templates were manually selected from each FCG recording and used to separately localize S1 and S2 sounds, as well as S1-S2 pairs. A simultaneously recorded electrocardiography (ECG) trace was used for performance evaluation. The results show that the template matching approach proved capable of separately classifying S1 and S2 sounds in more than 96% of all heartbeats. Linear regression, correlation, and Bland-Altman analyses showed that inter-beat intervals were estimated with high accuracy. Indeed, the estimation error was confined within 10 ms, with negligible impact on heart rate estimation. Heart rate variability (HRV) indices were also computed and turned out to be almost comparable with those obtained from ECG. The preliminary yet encouraging results of this study suggest that the template matching approach based on normalized cross-correlation allows very accurate heart sounds localization and inter-beat intervals estimation.
Keywords: forcecardiography; heart rate variability; heart sounds; normalized cross-correlation; template matching.
Conflict of interest statement
The sensor described in this manuscript is protected by the patent WO/2021/072493. E.A. and D.E. are listed as inventors. J.C. and S.P. declare no conflict of interest.
Figures


Similar articles
-
A Flexible PVDF Sensor for Forcecardiography.Sensors (Basel). 2025 Mar 6;25(5):1608. doi: 10.3390/s25051608. Sensors (Basel). 2025. PMID: 40096462 Free PMC article.
-
A Novel Broadband Forcecardiography Sensor for Simultaneous Monitoring of Respiration, Infrasonic Cardiac Vibrations and Heart Sounds.Front Physiol. 2021 Nov 18;12:725716. doi: 10.3389/fphys.2021.725716. eCollection 2021. Front Physiol. 2021. PMID: 34867438 Free PMC article.
-
ECG-Free Heartbeat Detection in Seismocardiography and Gyrocardiography Signals Provides Acceptable Heart Rate Variability Indices in Healthy and Pathological Subjects.Sensors (Basel). 2023 Sep 27;23(19):8114. doi: 10.3390/s23198114. Sensors (Basel). 2023. PMID: 37836942 Free PMC article.
-
Analysis of phonocardiogram signals using wavelet transform.J Med Eng Technol. 2012 Aug;36(6):283-302. doi: 10.3109/03091902.2012.684830. Epub 2012 Jun 28. J Med Eng Technol. 2012. PMID: 22738192 Review.
-
Phonocardiogram signal analysis: a review.Crit Rev Biomed Eng. 1987;15(3):211-36. Crit Rev Biomed Eng. 1987. PMID: 3329595 Review.
Cited by
-
A Narrowband IoT Personal Sensor for Long-Term Heart Rate Monitoring and Atrial Fibrillation Detection.Sensors (Basel). 2024 Jul 9;24(14):4432. doi: 10.3390/s24144432. Sensors (Basel). 2024. PMID: 39065829 Free PMC article.
-
A Forcecardiography dataset with simultaneous SCG, Heart Sounds, ECG, and Respiratory signals.Sci Data. 2025 Aug 6;12(1):1370. doi: 10.1038/s41597-025-05694-2. Sci Data. 2025. PMID: 40769990 Free PMC article.
-
Fully automated template matching method for ECG-free heartbeat detection in cardiomechanical signals of healthy and pathological subjects.Phys Eng Sci Med. 2025 Jun;48(2):649-664. doi: 10.1007/s13246-025-01531-3. Epub 2025 Mar 13. Phys Eng Sci Med. 2025. PMID: 40080259 Free PMC article.
-
Accuracy of the Instantaneous Breathing and Heart Rates Estimated by Smartphone Inertial Units.Sensors (Basel). 2025 Feb 12;25(4):1094. doi: 10.3390/s25041094. Sensors (Basel). 2025. PMID: 40006324 Free PMC article.
-
A Flexible PVDF Sensor for Forcecardiography.Sensors (Basel). 2025 Mar 6;25(5):1608. doi: 10.3390/s25051608. Sensors (Basel). 2025. PMID: 40096462 Free PMC article.
References
-
- Fowler N.O. Diagnosis of Heart Disease. Springer; New York, NY, USA: 1991. Precordial Palpation and Auscultation; pp. 23–37. - DOI
-
- Hutchins J. Handbook of Cardiac Anatomy, Physiology, and Devices. 3rd ed. Springer; New York, NY, USA: 2015. Blood Pressure, Heart Tones, and Diagnoses; pp. 313–320. - DOI
MeSH terms
LinkOut - more resources
Full Text Sources

