

Identification of Single Nucleotide Polymorphic Loci and Candidate Genes for Seed Germination Percentage in Okra under Salt and No-Salt Stresses by Genome-Wide Association Study
- PMID: 38475435
- PMCID: PMC10934433
- DOI: 10.3390/plants13050588
Identification of Single Nucleotide Polymorphic Loci and Candidate Genes for Seed Germination Percentage in Okra under Salt and No-Salt Stresses by Genome-Wide Association Study
Abstract
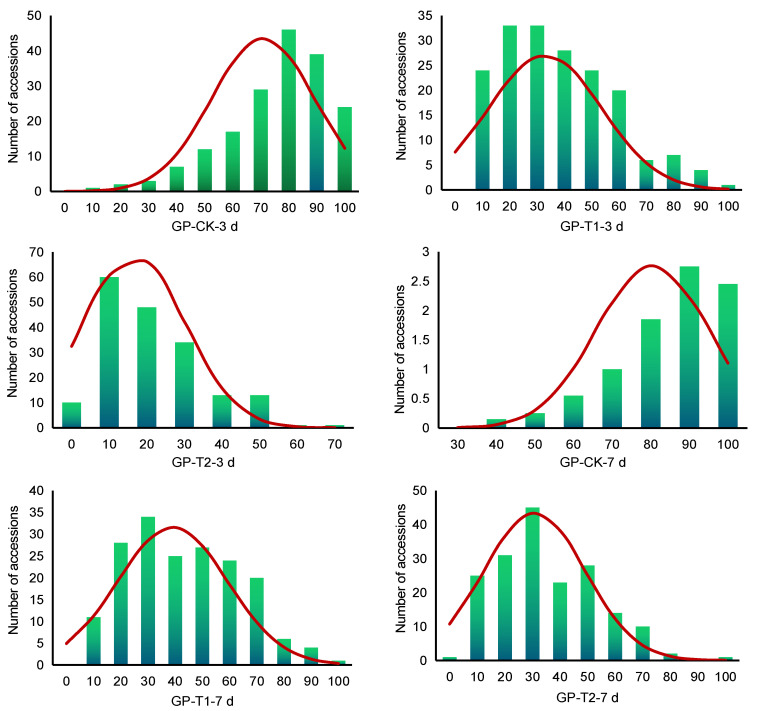
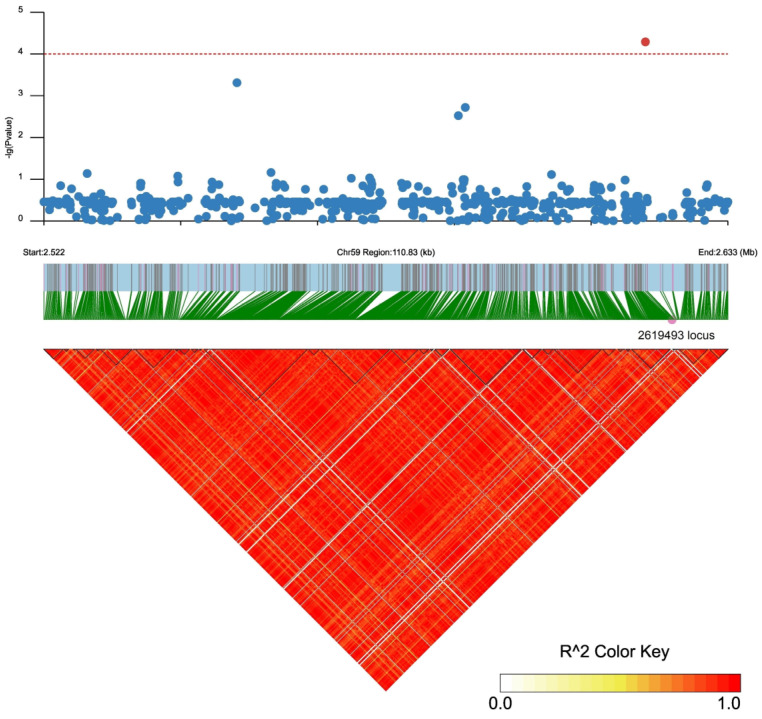
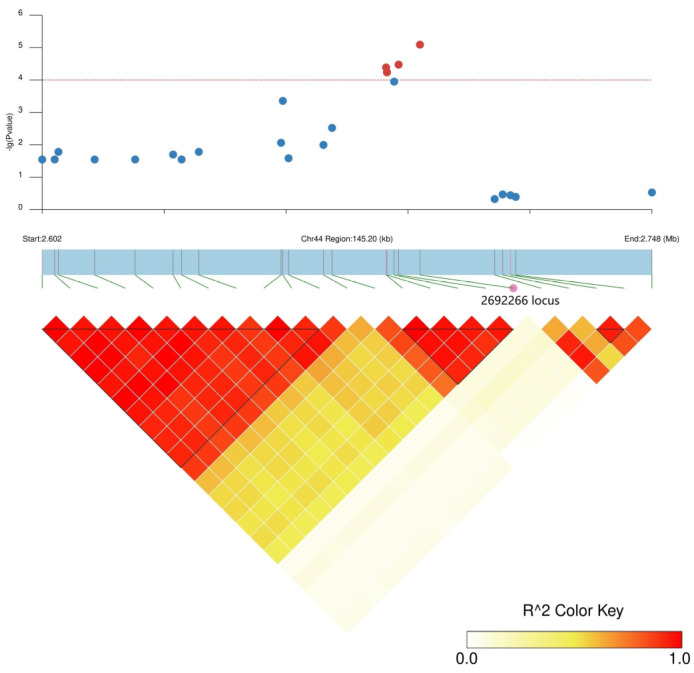
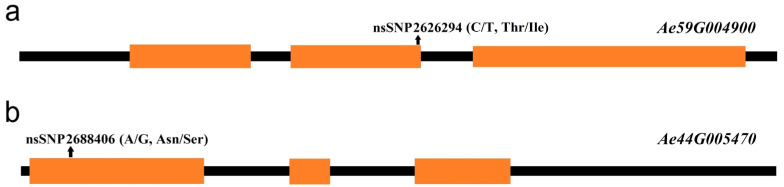
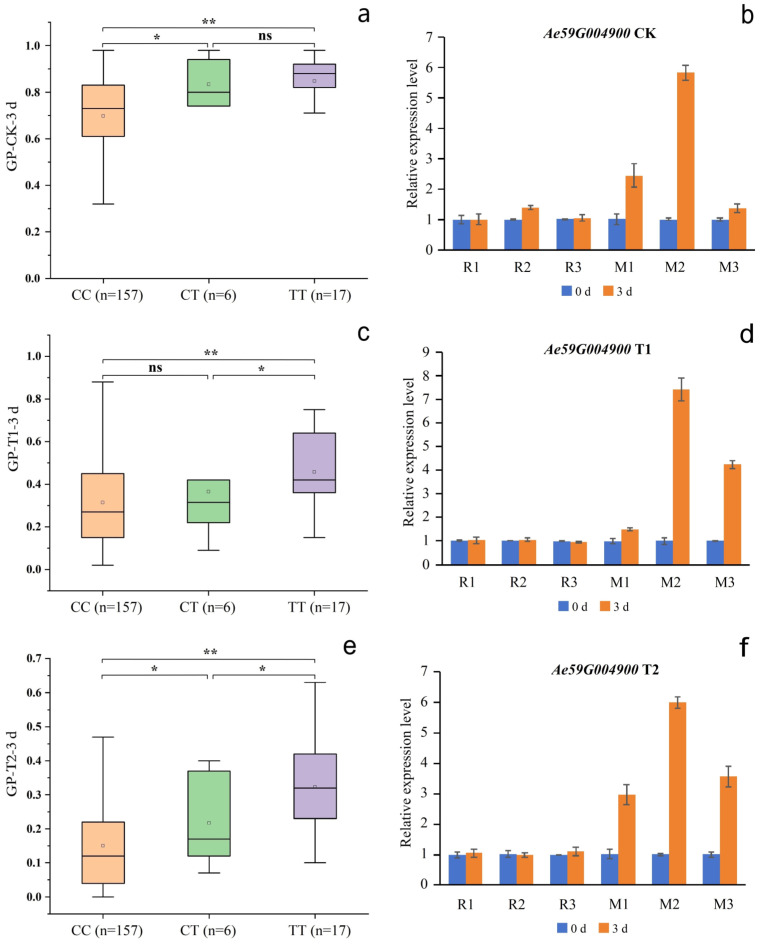
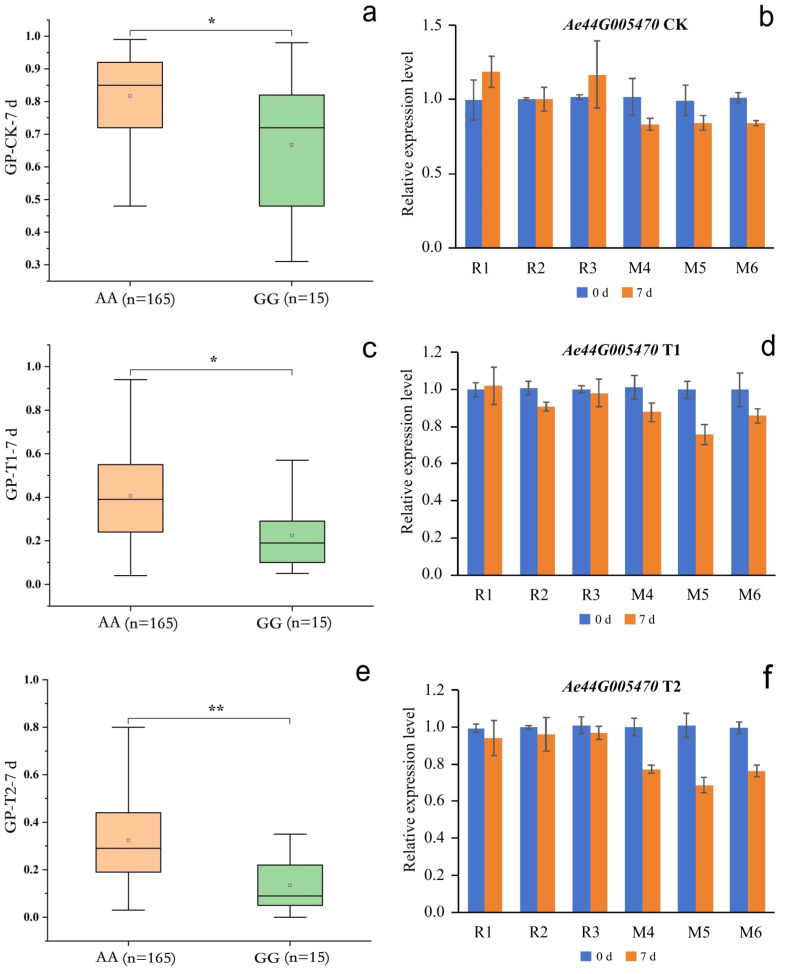
Excessive soil salinity is a major stressor inhibiting crops' growth, development, and yield. Seed germination is a critical stage of crop growth and development, as well as one of the most salt-sensitive stages. Salt stress has a significant inhibitory effect on seed germination. Okra is a nutritious vegetable, but its seed germination percentage (GP) is low, whether under salt stress conditions or suitable conditions. In this study, we used 180 okra accessions and conducted a genome-wide association study (GWAS) on the germination percentage using 20,133,859 single nucleotide polymorphic (SNP) markers under 0 (CK, diluted water), 70 (treatment 1, T1), and 140 mmol/L (treatment 2, T2) NaCl conditions. Using the mixed linear model (MLM) in Efficient Mixed-model Association eXpedated (EMMAX) and Genome-wide Efficient Mixed Model Association (GEMMA) software, 511 SNP loci were significantly associated during germination, of which 167 SNP loci were detected simultaneously by both programs. Among the 167 SNPs, SNP2619493 on chromosome 59 and SNP2692266 on chromosome 44 were detected simultaneously under the CK, T1, and T2 conditions, and were key SNP loci regulating the GP of okra seeds. Linkage disequilibrium block analysis revealed that nsSNP2626294 (C/T) in Ae59G004900 was near SNP2619493, and the amino acid changes caused by nsSNP2626294 led to an increase in the phenotypic values in some okra accessions. There was an nsSNP2688406 (A/G) in Ae44G005470 near SNP2692266, and the amino acid change caused by nsSNP2688406 led to a decrease in phenotypic values in some okra accessions. These results indicate that Ae59G004900 and Ae44G005470 regulate the GP of okra seeds under salt and no-salt stresses. The gene expression analysis further demonstrated these results. The SNP markers and genes that were identified in this study will provide reference for further research on the GP of okra, as well as new genetic markers and candidate genes for cultivating new okra varieties with high GPs under salt and no-salt stress conditions.
Keywords: GWAS; candidate gene; germination; okra; salt tolerance.
Conflict of interest statement
The authors declare no conflicts of interest.
Figures

Similar articles
-
Genome-wide association study of salt tolerance at the seed germination stage in rice.BMC Plant Biol. 2017 May 30;17(1):92. doi: 10.1186/s12870-017-1044-0. BMC Plant Biol. 2017. PMID: 28558653 Free PMC article.
-
Genome-wide association study of salt tolerance at the seed germination stage in lettuce.PLoS One. 2024 Oct 18;19(10):e0308818. doi: 10.1371/journal.pone.0308818. eCollection 2024. PLoS One. 2024. PMID: 39423209 Free PMC article.
-
Genome-Wide Association Study of Salt Tolerance-Related Traits during Germination and Seedling Development in an Intermedium-Spike Barley Collection.Int J Mol Sci. 2022 Sep 21;23(19):11060. doi: 10.3390/ijms231911060. Int J Mol Sci. 2022. PMID: 36232362 Free PMC article.
-
Identification of genetic variation for salt tolerance in Brassica napus using genome-wide association mapping.Mol Genet Genomics. 2021 Mar;296(2):391-408. doi: 10.1007/s00438-020-01749-8. Epub 2021 Jan 19. Mol Genet Genomics. 2021. PMID: 33464396
-
Genome-wide association study uncovers major genetic loci associated with seed flooding tolerance in soybean.BMC Plant Biol. 2021 Oct 29;21(1):497. doi: 10.1186/s12870-021-03268-z. BMC Plant Biol. 2021. PMID: 34715792 Free PMC article.
Cited by
-
Genome-wide association studies reveal novel QTLs for agronomic traits in soybean.Front Plant Sci. 2024 May 14;15:1375646. doi: 10.3389/fpls.2024.1375646. eCollection 2024. Front Plant Sci. 2024. PMID: 38807775 Free PMC article.
References
-
- Baloch M.Y.J., Zhang W.J., Sultana T., Akram M., Shoumik B.A.A., Khan M.Z., Farooq M.A. Utilization of sewage sludge to manage saline-alkali soil and increase crop production: Is it safe or not? Environ. Technol. Inno. 2023;32:103266. doi: 10.1016/j.eti.2023.103266. - DOI
Grants and funding
LinkOut - more resources
Full Text Sources
Research Materials
