

An Experimental Investigation of the Precipitation Utilization of Plants in Arid Regions
- PMID: 38475440
- PMCID: PMC10934922
- DOI: 10.3390/plants13050594
An Experimental Investigation of the Precipitation Utilization of Plants in Arid Regions
Abstract
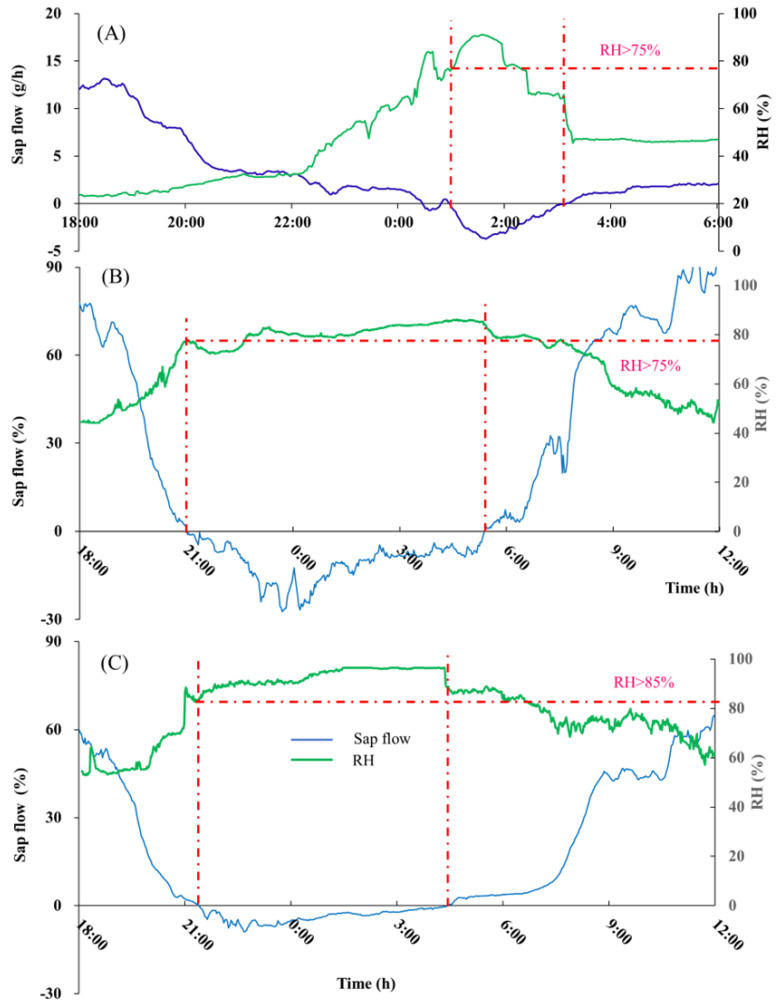
What represents a water source for the ecological restoration of a plant in an arid region is still up to debate. To address this issue, we conducted an in situ experiment in the Ulan Buh Desert of China, to study desert plants absorbing atmospheric water vapor. We selected Tamarisk, a common drought-salt-tolerant species in the desert, for ecological restoration as our research subject, used a newly designed lysimeter to monitor precipitation infiltration, and a sap flow system to track reverse sap flow that occurred in the shoot, branch, and stem during the precipitation event, and observed the precipitation redistribution process of the Tamarisk plot. The results showed that Tamarisk indeed directly absorbs precipitation water: when precipitation occurs, the main stem, lateral branch, and shoot all show the signs of reversed sap flow, and the reversed sap flow accounted for 21.5% of the annual sap flow in the shoot and branch, and 13.6% in the stem. The precipitation event in the desert was dominated by light precipitation events, which accounted for 81% of the annual precipitation events. It was found that light precipitation can be directly absorbed by the Tamarisk leaves, especially during nighttime or cloudy days. Even when the precipitation is absent, it was found that desert plants can still absorb water from the unsaturated atmospheric vapor; even the absorbed atmospheric water vapor was transported from the leaves to the stem, forming a reversed sap flow, as a reversed sap flow was observed when the atmospheric relative humidity reached 75%. This study indicated that the effect of light precipitation on desert plants was significant and should not be overlooked in terms of managing the ecological and hydrological systems in arid regions.
Keywords: Tamarisk; Ulan Buh Desert; arid area; atmospheric moisture; reverse sap flow.
Conflict of interest statement
Author Wenbin Yang was employed by the company Low-Coverage Sand Control Company. The remaining authors declare that the research was conducted in the absence of any commercial or financial relationships that could be construed as a potential conflict of interest.
Figures


Similar articles
-
Atmospheric Vapor Impact on Desert Vegetation and Desert Ecohydrological System.Plants (Basel). 2023 Jan 4;12(2):223. doi: 10.3390/plants12020223. Plants (Basel). 2023. PMID: 36678936 Free PMC article.
-
[Improvement of remote sensing ecological index in arid regions: Taking Ulan Buh Desert as an example].Ying Yong Sheng Tai Xue Bao. 2020 Nov;31(11):3795-3804. doi: 10.13287/j.1001-9332.202011.011. Ying Yong Sheng Tai Xue Bao. 2020. PMID: 33300730 Chinese.
-
Harvesting water from unsaturated atmospheres: deliquescence of salt secreted onto leaf surfaces drives reverse sap flow in a dominant arid climate mangrove, Avicennia marina.New Phytol. 2021 Aug;231(4):1401-1414. doi: 10.1111/nph.17461. Epub 2021 Jun 12. New Phytol. 2021. PMID: 33983649
-
Toxicity bioassays for ecological risk assessment in arid and semiarid ecosystems.Rev Environ Contam Toxicol. 2001;168:43-98. doi: 10.1007/978-1-4613-0143-1_2. Rev Environ Contam Toxicol. 2001. PMID: 12882227 Review.
-
Precipitation extremes observed over and around the Taklimakan Desert, China.PeerJ. 2023 May 10;11:e15256. doi: 10.7717/peerj.15256. eCollection 2023. PeerJ. 2023. PMID: 37193019 Free PMC article. Review.
References
-
- Philip J.R. Plant water relations: Some physical aspects. Annu. Rev. Plant Physiol. 1966;17:245–268. doi: 10.1146/annurev.pp.17.060166.001333. - DOI
LinkOut - more resources
Full Text Sources
Miscellaneous
