. 2024 Mar 12;74(1):16.
doi: 10.1186/s12576-024-00911-w.

Action of GABAB receptor on local network oscillation in somatosensory cortex of oral part: focusing on NMDA receptor

Affiliations

Action of GABAB receptor on local network oscillation in somatosensory cortex of oral part: focusing on NMDA receptor

Hiroyuki Kanayama et al. J Physiol Sci. .

Abstract

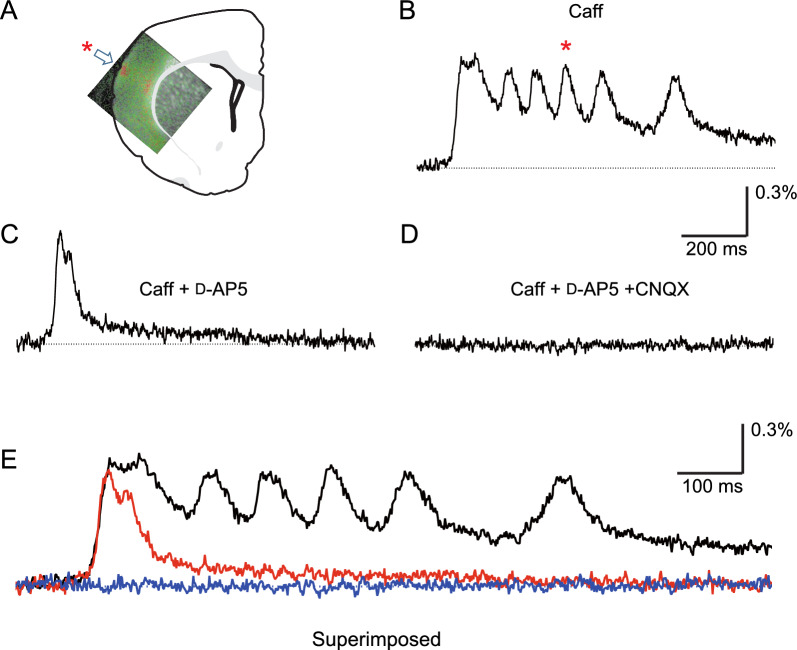
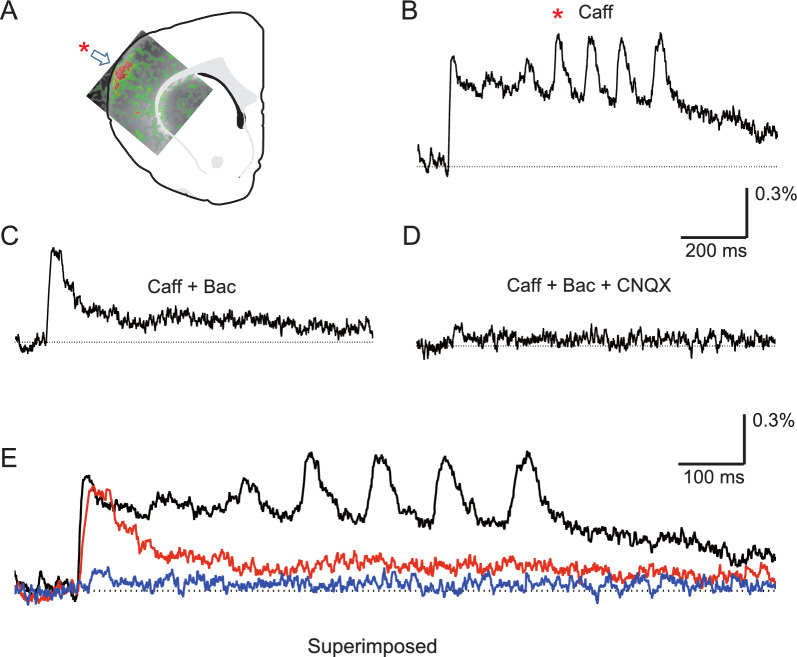
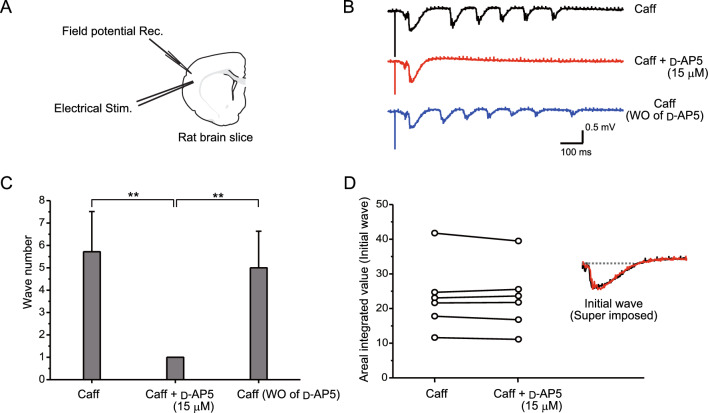
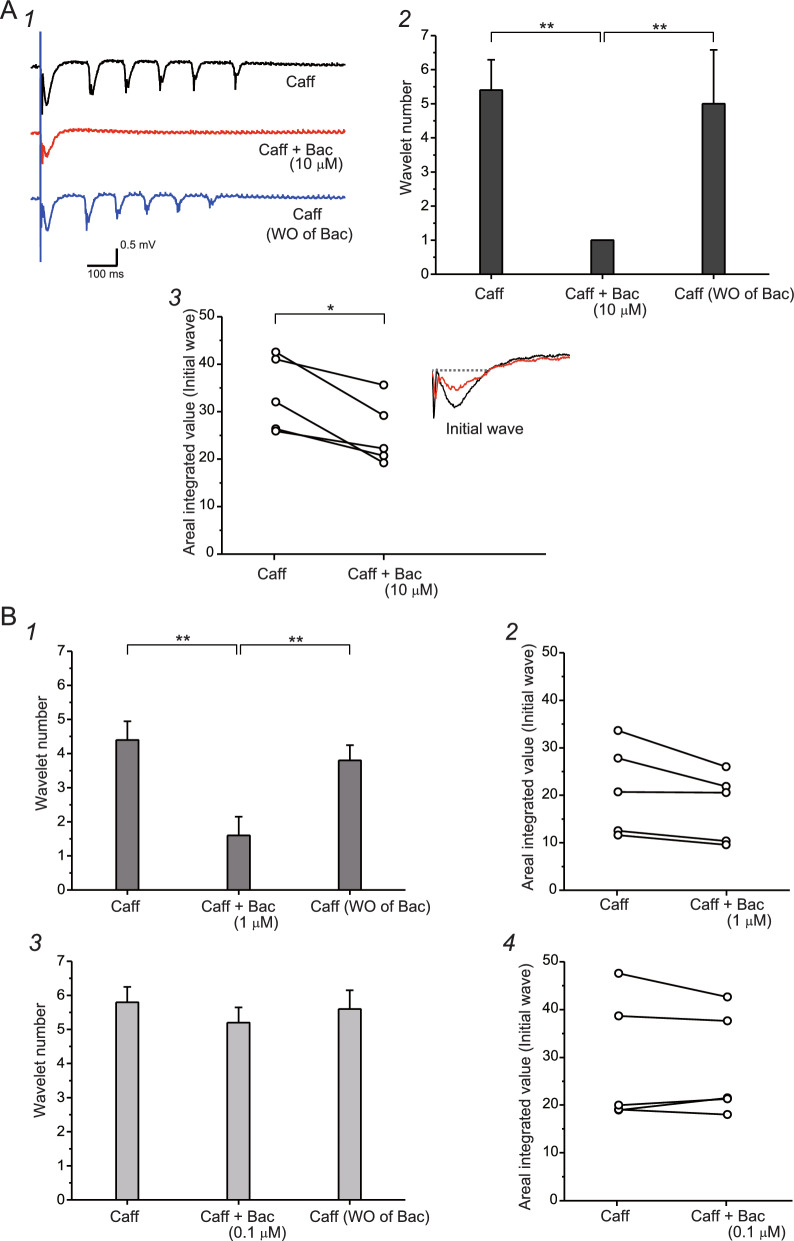
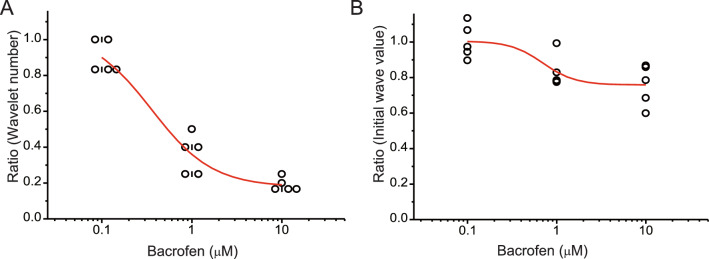
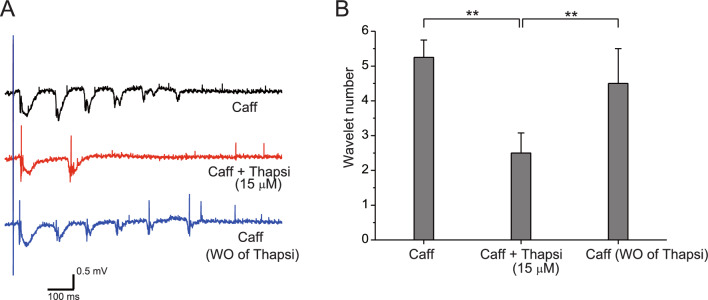
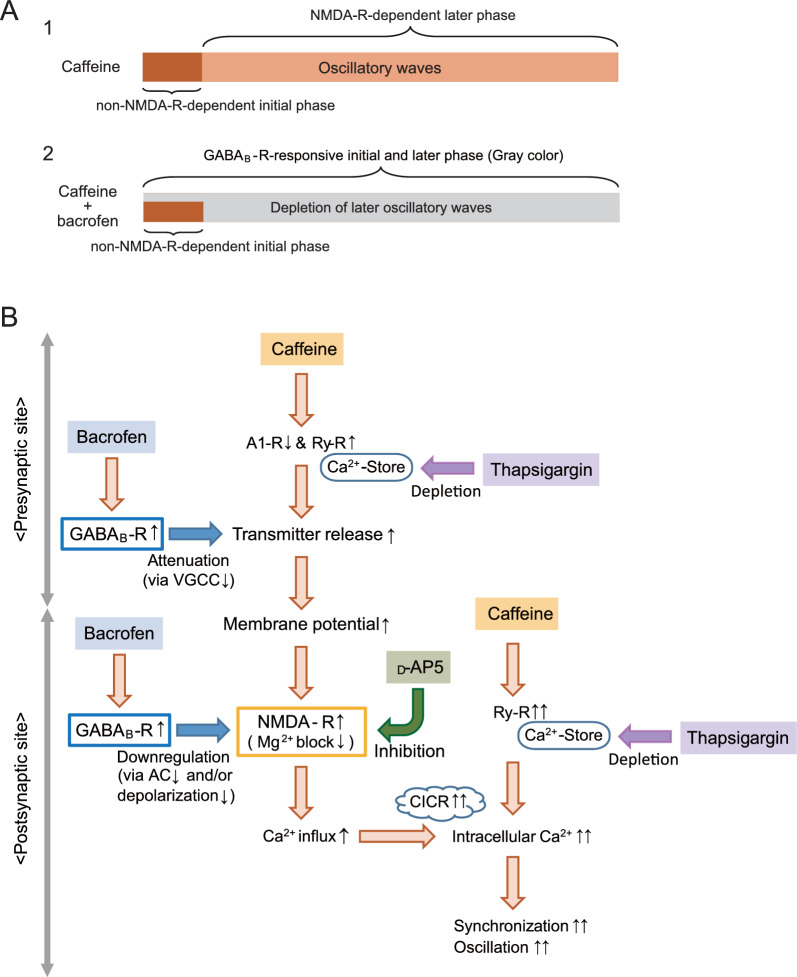
The balance of activity between glutamatergic and GABAergic networks is particularly important for oscillatory neural activities in the brain. Here, we investigated the roles of GABAB receptors in network oscillation in the oral somatosensory cortex (OSC), focusing on NMDA receptors. Neural oscillation at the frequency of 8-10 Hz was elicited in rat brain slices after caffeine application. Oscillations comprised a non-NMDA receptor-dependent initial phase and a later NMDA receptor-dependent oscillatory phase, with the oscillator located in the upper layer of the OSC. Baclofen was applied to investigate the actions of GABAB receptors. The later NMDA receptor-dependent oscillatory phase completely disappeared, but the initial phase did not. These results suggest that GABAB receptors mainly act on NMDA receptor, in which metabotropic actions of GABAB receptors may contribute to the attenuation of NMDA receptor activities. A regulatory system for network oscillation involving GABAB receptors may be present in the OSC.

Keywords: Caffeine; GABAB receptor; NMDA receptor; Network oscillation; Oral somatosensory cortex; Voltage-sensitive dye.


Conflict of interest statement

The authors have no relevant financial or non-financial interests to disclose.

Figures

Fig. 1
Fig. 1
Pharmacological analysis of caffeine-assisted oscillation elicited by intra-cortical stimulation in the OSC, focusing on NMDA receptors. An optical recording method was applied. All recordings were performed in caffeine-containing medium. A Optical image acquired at a time latency of 337.0 ms superimposed on the slice illustration. The image includes a high-activity area during one course of oscillation (as shown in B). Note that a high-activity area that emerged repeatedly is considered the origin of oscillatory activities. Thus, the location of oscillatory origin was confirmed to be in the upper layer of the somatosensory cortex, as indicated by the arrow. B Time-course responses of the optical signal obtained at the oscillatory origin (as shown in A). Note that the local area shown in A with the asterisk generated the wave with the asterisk in B. C Time-course response after application of d-AP5 in caffeine-containing medium. Note that the oscillatory phase completely disappeared, but the initial wave did not. The initial slope and peak amplitude of the initial wave were almost the same as those before application of d-AP5. D Time-course response after further application of CNQX in medium containing both caffeine and d-AP5. Note that the initial wave completely disappeared. E The 3 time-course responses shown in BD are superimposed, and the temporal axis is expanded
Fig. 2
Fig. 2
Pharmacological analysis of caffeine-assisted oscillation elicited by intra-cortical stimulation in the OSC, focusing on GABAB receptors. An optical recording method was applied. All recordings were performed in caffeine-containing medium. A Optical image acquired at a time latency of 310.8 ms is superimposed on the slice illustration. The image includes a high-activity area during one course of oscillation (as shown in B). Note that the high-activity area that emerged repeatedly is considered the origin of oscillatory activities. The location of oscillatory origin was thus confirmed to be in the upper layer of the somatosensory cortex, as indicated by the indicated by the arrow. B One time-course response of the optical signal obtained at the oscillatory origin (as shown in A). Note that the local area shown in A with the asterisk generated the wave with the asterisk in B. C Time-course response after application of baclofen in caffeine-containing medium. Note that the oscillatory phase completely disappeared, but the initial phase did not. The initial slope and peak amplitude of the initial wave were slightly decreased as compared with those before the application of baclofen, and slight depolarization continued during the later phase. D Time-course response after further application of CNQX in medium containing both caffeine and baclofen. Note that most of the initial wave disappeared. E The 3 time-course responses shown in BD are superimposed, and the temporal axis is expanded
Fig. 3
Fig. 3
Analysis of the initial wave and later oscillatory phase of caffeine-assisted oscillation, focusing on NMDA receptors. A field potential recording method was applied. A A glass micropipette for field potential recording and an electrode for stimulation are shown in a brain slice illustration. Field potentials were recorded from layer II/III, and electrical stimulation was delivered to layer IV in the OSC. B Waveforms obtained by field potential recording. Stable oscillation was generated in the caffeine-containing medium (top). Application of d-AP5 blocked the oscillatory phase, but not the initial phase (middle). After washout of d-AP5, the oscillatory phase reappeared (bottom). C Averages of wavelet number before and during d-AP5 application to caffeine-containing medium, and after washout of d-AP5. D Areal integrated values of the initial wave before and after application of d-AP5. Representative waveforms before and during d-AP5 application are superimposed and shown in the graph. Note that application of d-AP5 has little effect on the initial wave. Asterisks (*P < 0.005; **P < 0.001) indicate significant statistical differences
Fig. 4
Fig. 4
Analysis of the initial wave and later oscillatory phase of caffeine-assisted oscillation, focusing on GABAB receptors. Field potential recording was performed, and electrical stimulation was delivered in the same manner shown in Fig. 3A. A1 Waveforms obtained by field potential recording. Stable oscillation was generated in the caffeine-containing medium (top). Application of 10 μM baclofen blocked the oscillatory phase, but not the initial phase (middle). After washout of baclofen, the oscillatory phase reappeared (bottom). A2 Averages of wavelet number before and during baclofen application to caffeine-containing medium, and after washout of baclofen. A3 Areal integrated values of the initial wave before and after application of baclofen. Representative waveforms before and during baclofen application are superimposed and shown in the graph. Note that application of baclofen clearly decreases initial wave size. B1 Averages of wavelet number before and during baclofen (1 μM) application to caffeine-containing medium, and after washout of baclofen. B2 Areal integrated values of initial wave before and after application of baclofen. Note that application of baclofen tends to decrease the initial wave size. B3 Averages of wavelet number before and during baclofen (0.1 μM) application to caffeine-containing medium, and after washout of baclofen. B4 Areal integrated values of initial wave before and after application of baclofen. Note that application of low-concentration baclofen does not seem to affect initial wave size. Asterisks (*P < 0.005; **P < 0.001) indicate significant statistical differences
Fig. 5
Fig. 5
Dose-dependent effects of baclofen. A Ratios of wavelet number before and after application of d-AP5 are plotted according to concentration of baclofen, followed by sigmoid curve fitting. Note that attenuation of oscillation by baclofen appears strongly dose dependent (R2 = 0.925). B Ratios of areal values of the initial wave before and after application of baclofen are plotted according to the concentration of baclofen, followed by sigmoid curve fitting. Note that attenuation of initial wave size by baclofen appears weakly dose dependent (R2 = 0.437)
Fig. 6
Fig. 6
Attenuation of caffeine-assisted oscillation by depletion of intracellular Ca2+ stores. Field potential recordings were performed, and electrical stimulation was delivered in the same way as shown in Fig. 3A. A Waveforms obtained by field potential recording. Stable oscillation was generated in the caffeine-containing medium (top). Application of 15 μM thapsigargin blocked the later oscillatory phase, but the initial and second waves remained (middle). After washout of baclofen, the oscillatory phase reappeared (bottom). B Averages of wavelet number before and during thapsigargin application to caffeine-containing medium, and after washout of thapsigargin. Asterisks (**P < 0.001) indicate significant statistical differences
Fig. 7
Fig. 7
Summary of results. A1 Caffeine-assisted oscillation was composed comprised an initial phase that is non-NMDA receptor dependent and a later oscillatory phase that is NMDA receptor dependent. A2 Application of baclofen attenuated the initial phase, and abolished the later oscillatory phase. Gray color area shows GABAB receptor-responsive components. Residual initial phase was non-NMDA receptor dependent. B Presumed downstream of GABAB receptor and NMDA receptor based on the present experiments. Application of caffeine induced oscillation via increase in NMDA receptor activity and CICR. Application of baclofen attenuated transmitter release at presynaptic site, and inhibited oscillatory phase via downregulation of NMDA receptor at postsynaptic site. Pharmacological actions of d-AP5 and thapsigargin are also illustrated. A1-R Adenosine A1 receptor, Ry-R ryanodine receptor, AC adenylyl cyclase

Similar articles

References

    1. D’Souza RD, Wang Q, Ji W, Meier AM, Kennedy H, Knoblauch K, Burkhaler A. Hierarchical and nonhierarchical features of the mouse visual cortical work. Nat Commun. 2022;13:503. doi: 10.1038/s41467-022-28035-y. - DOI - PMC - PubMed
    1. Semedo JD, Jasper AI, Zandvakili A, Krishner A, Machens CK, Kohn A, Yu BM. Feedforward and feedback interactions between visual cortical areas use different population activity patterns. Nat Commun. 2022;13:1099. doi: 10.1038/s41467-022-28552-w. - DOI - PMC - PubMed
    1. Shao Z, Burkhalter A. Different balance of excitation and inhibition in forward and feedback circuits of rat visual cortex. J Neurosci. 1996;16(22):7353–7365. doi: 10.1523/JNEUROSCI.16-22-07353.1996. - DOI - PMC - PubMed
    1. Mejias JF, Murray JD, Kennedy H, Wang W-J. Feedforward and feedback frequency-dependent interactions in a large-scale laminar network of the primate cortex. Sci Adv. 2016;2:e1601335. doi: 10.1126/sciadv.1601335. - DOI - PMC - PubMed
    1. Buzáki G, Watson BO. Brain rhythms and neural syntax: implications for efficient coding of cognitive content and neuropsychiatric disease. Dialog Clini Neurosci. 2012;14:345–367. doi: 10.31887/DCNS.2012.14.4/gbuzsaki. - DOI - PMC - PubMed