

Decoding HiPSC-CM's Response to SARS-CoV-2: mapping the molecular landscape of cardiac injury
- PMID: 38475718
- PMCID: PMC10936015
- DOI: 10.1186/s12864-024-10194-5
Decoding HiPSC-CM's Response to SARS-CoV-2: mapping the molecular landscape of cardiac injury
Abstract
Background: Acute cardiac injury caused by coronavirus disease 2019 (COVID-19) increases mortality. Acute cardiac injury caused by COVID-19 requires understanding how severe acute respiratory syndrome coronavirus 2 (SARS-CoV-2) directly infects cardiomyocytes. This study provides a solid foundation for related studies by using a model of SARS-CoV-2 infection in human induced pluripotent stem cell-derived cardiomyocytes (hiPSC-CMs) at the transcriptome level, highlighting the relevance of this study to related studies. SARS-CoV-2 infection in hiPSC-CMs has previously been studied by bioinformatics without presenting the full molecular biological process. We present a unique bioinformatics view of the complete molecular biological process of SARS-CoV-2 infection in hiPSC-CMs.
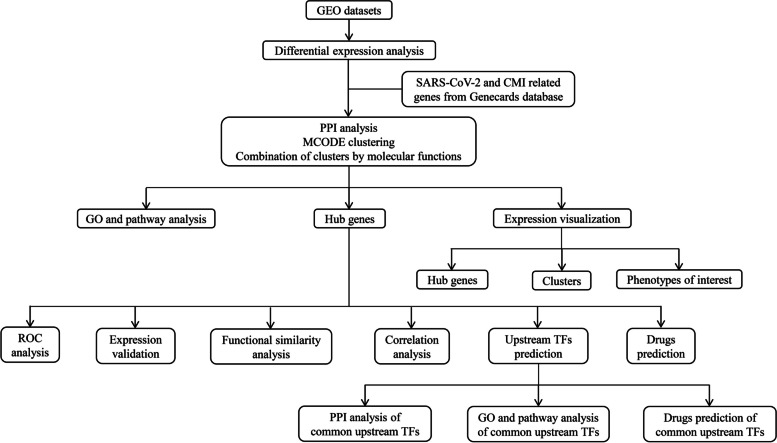
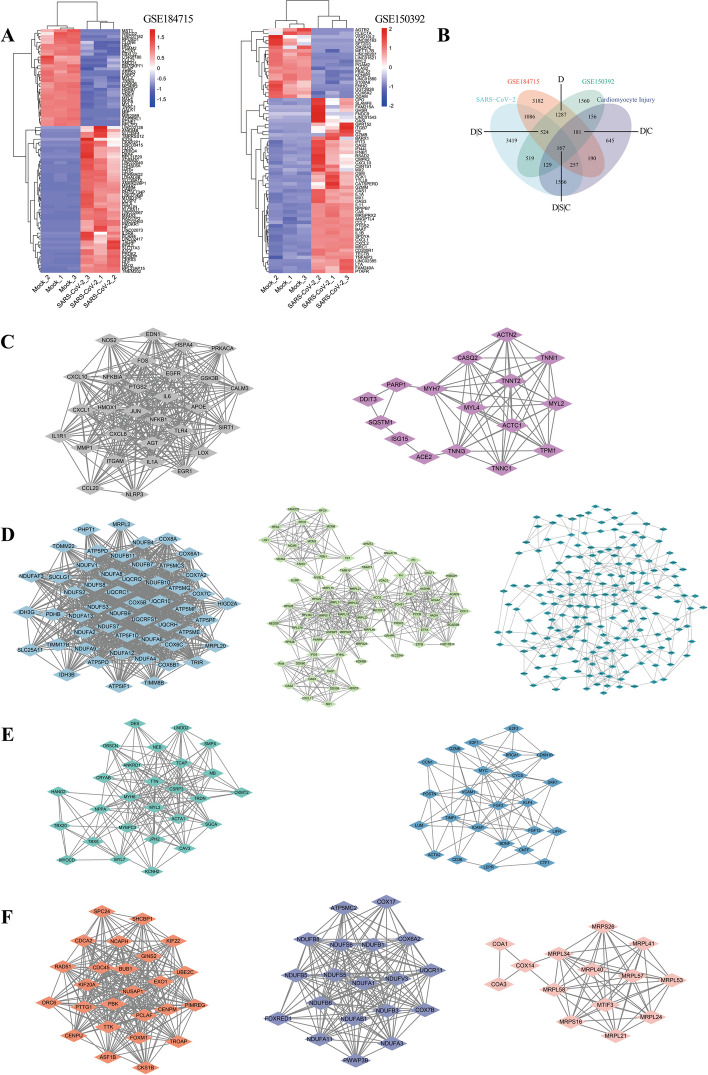
Methods: To validate the RNA-seq datasets, we used GSE184715 and GSE150392 for the analytical studies, GSE193722 for validation at the cellular level, and GSE169241 for validation in heart tissue samples. GeneCards and MsigDB databases were used to find genes associated with the phenotype. In addition to differential expression analysis and principal component analysis (PCA), we also performed protein-protein interaction (PPI) analysis, functional enrichment analysis, hub gene analysis, upstream transcription factor prediction, and drug prediction.
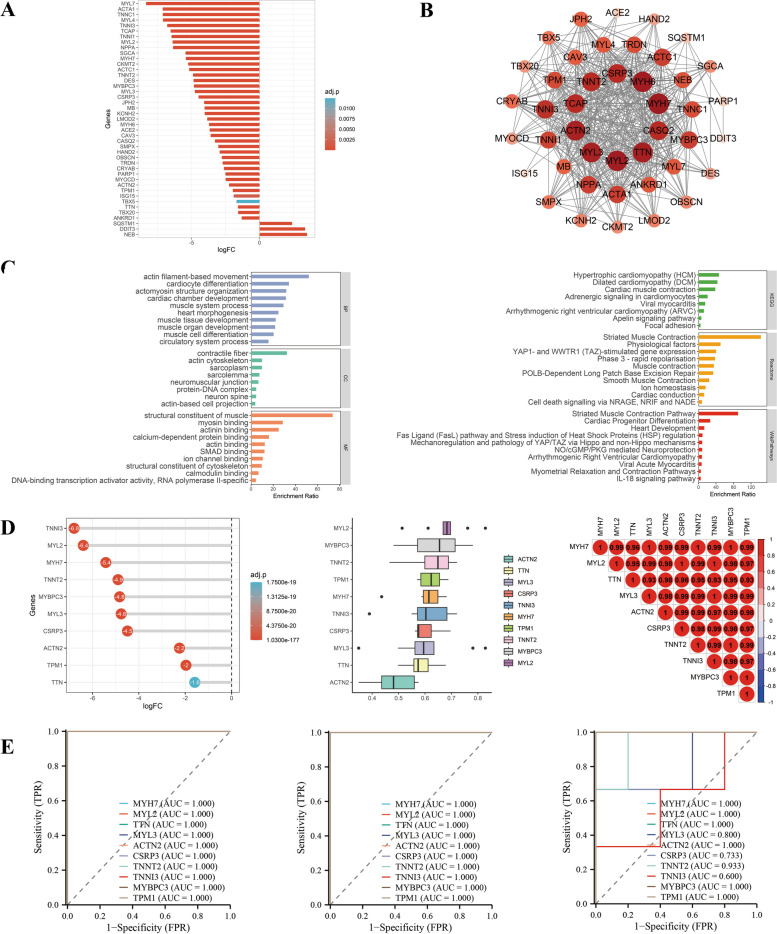
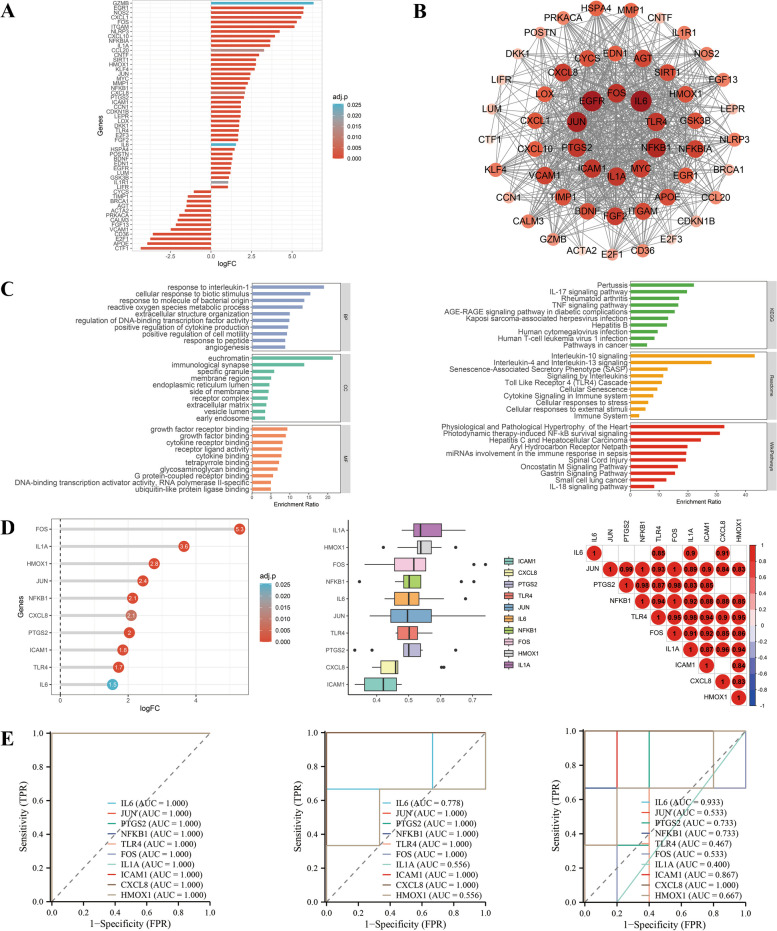
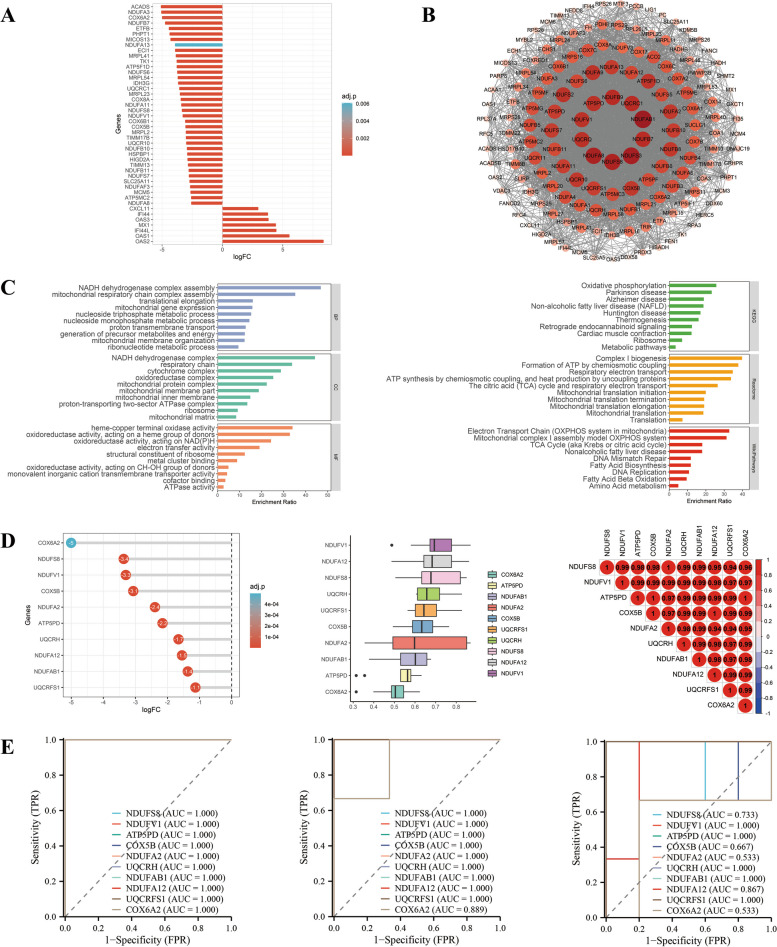
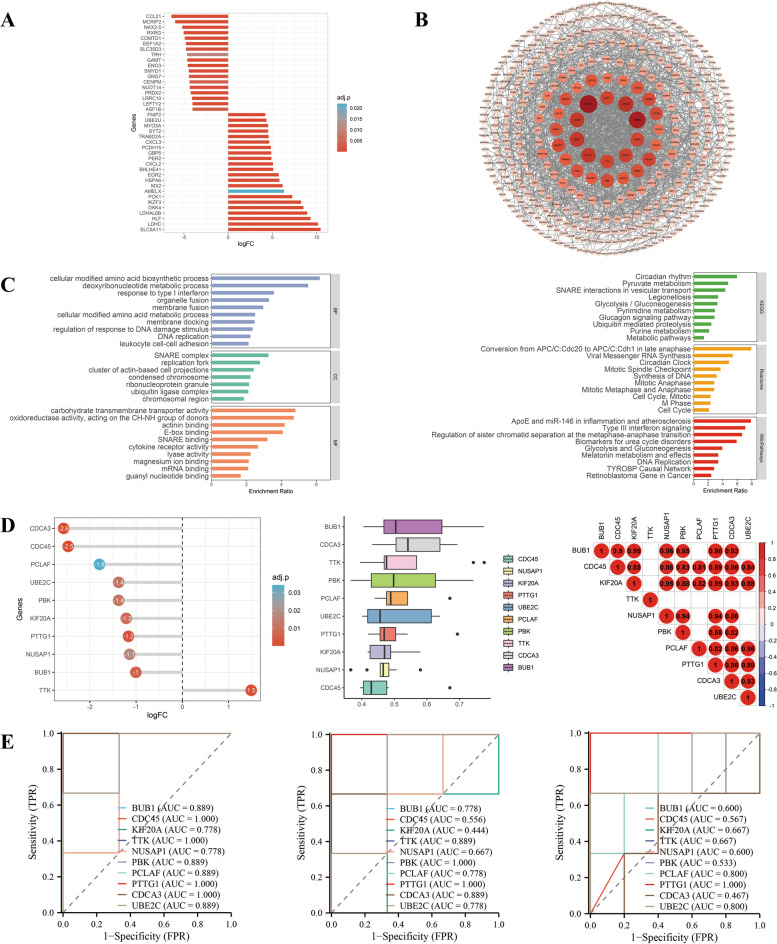
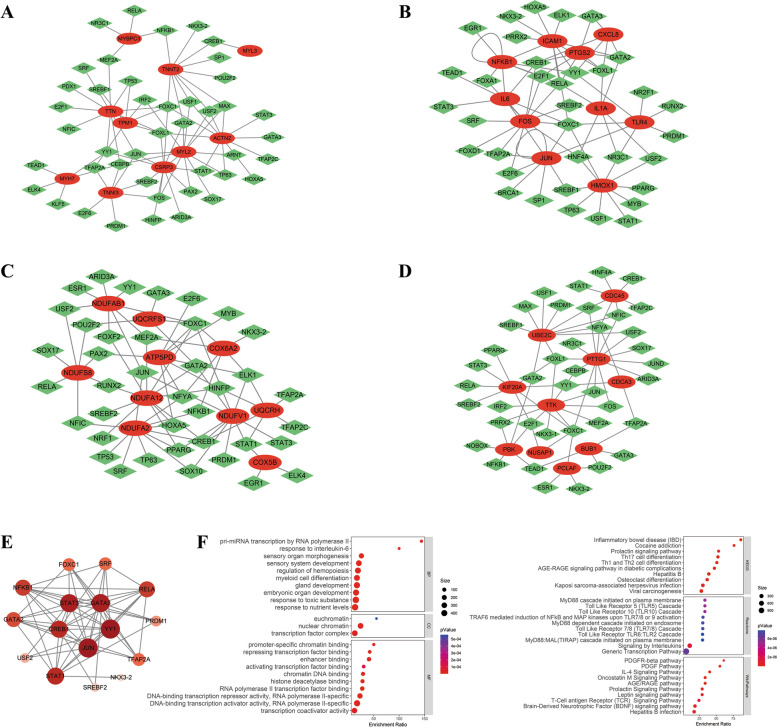
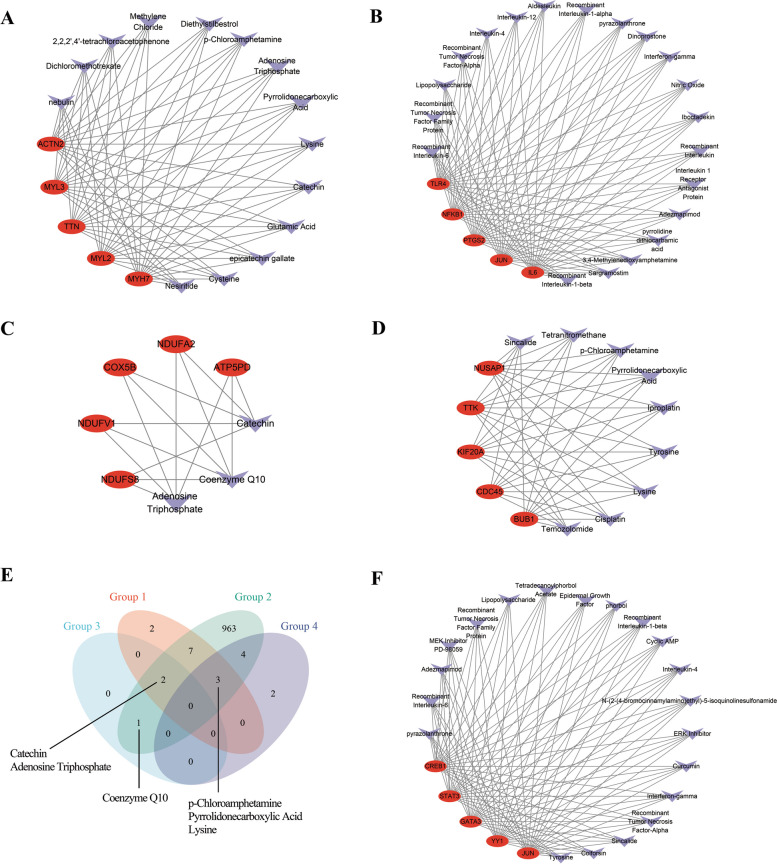
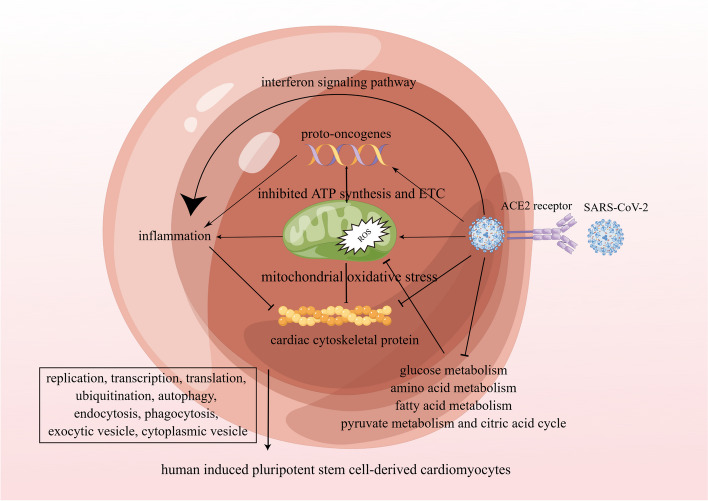
Results: Differentially expressed genes (DEGs) were classified into four categories: cardiomyocyte cytoskeletal protein inhibition, proto-oncogene activation and inflammation, mitochondrial dysfunction, and intracellular cytoplasmic physiological function. Each of the hub genes showed good diagnostic prediction, which was well validated in other datasets. Inhibited biological functions included cardiomyocyte cytoskeletal proteins, adenosine triphosphate (ATP) synthesis and electron transport chain (ETC), glucose metabolism, amino acid metabolism, fatty acid metabolism, pyruvate metabolism, citric acid cycle, nucleic acid metabolism, replication, transcription, translation, ubiquitination, autophagy, and cellular transport. Proto-oncogenes, inflammation, nuclear factor-kappaB (NF-κB) pathways, and interferon signaling were activated, as well as inflammatory factors. Viral infection activates multiple pathways, including the interferon pathway, proto-oncogenes and mitochondrial oxidative stress, while inhibiting cardiomyocyte backbone proteins and energy metabolism. Infection limits intracellular synthesis and metabolism, as well as the raw materials for mitochondrial energy synthesis. Mitochondrial dysfunction and energy abnormalities are ultimately caused by proto-oncogene activation and SARS-CoV-2 infection. Activation of the interferon pathway, proto-oncogene up-regulation, and mitochondrial oxidative stress cause the inflammatory response and lead to diminished cardiomyocyte contraction. Replication, transcription, translation, ubiquitination, autophagy, and cellular transport are among the functions that decline physiologically.
Conclusion: SARS-CoV-2 infection in hiPSC-CMs is fundamentally mediated via mitochondrial dysfunction. Therapeutic interventions targeting mitochondrial dysfunction may alleviate the cardiovascular complications associated with SARS-CoV-2 infection.
Keywords: Biological significance; Mitochondrial dysfunction; Molecular mechanisms; SARS-CoV-2; Transcriptome analysis; hiPSC-CMs.
© 2024. The Author(s).
Conflict of interest statement
The authors declare no competing interests.
Figures
Similar articles
-
The molecular mechanism of cardiac injury in SARS-CoV-2 infection: Focus on mitochondrial dysfunction.J Infect Public Health. 2023 May;16(5):746-753. doi: 10.1016/j.jiph.2023.03.015. Epub 2023 Mar 17. J Infect Public Health. 2023. PMID: 36958170 Free PMC article.
-
Network pharmacology and RNA-sequencing reveal the molecular mechanism of Xuebijing injection on COVID-19-induced cardiac dysfunction.Comput Biol Med. 2021 Apr;131:104293. doi: 10.1016/j.compbiomed.2021.104293. Epub 2021 Feb 22. Comput Biol Med. 2021. PMID: 33662681 Free PMC article.
-
Highly Efficient SARS-CoV-2 Infection of Human Cardiomyocytes: Spike Protein-Mediated Cell Fusion and Its Inhibition.J Virol. 2021 Nov 23;95(24):e0136821. doi: 10.1128/JVI.01368-21. Epub 2021 Oct 6. J Virol. 2021. PMID: 34613786 Free PMC article.
-
Direct mechanisms of SARS-CoV-2-induced cardiomyocyte damage: an update.Virol J. 2022 Jun 25;19(1):108. doi: 10.1186/s12985-022-01833-y. Virol J. 2022. PMID: 35752810 Free PMC article. Review.
-
Possible Pathogenesis and Prevention of Long COVID: SARS-CoV-2-Induced Mitochondrial Disorder.Int J Mol Sci. 2023 Apr 28;24(9):8034. doi: 10.3390/ijms24098034. Int J Mol Sci. 2023. PMID: 37175745 Free PMC article. Review.
Cited by
-
Comparative transcriptome analysis of whiteflies raised on cotton leaf curl Multan virus-infected cotton plants.Front Vet Sci. 2024 Aug 28;11:1417590. doi: 10.3389/fvets.2024.1417590. eCollection 2024. Front Vet Sci. 2024. PMID: 39263677 Free PMC article.
References
MeSH terms
Substances
LinkOut - more resources
Full Text Sources
Medical
Miscellaneous
