. 2024 Mar 12;21(1):26.
doi: 10.1186/s12987-024-00524-w.

Transient but not chronic hyperglycemia accelerates ocular glymphatic transport

Affiliations

Transient but not chronic hyperglycemia accelerates ocular glymphatic transport

Christine Delle et al. Fluids Barriers CNS. .

Abstract

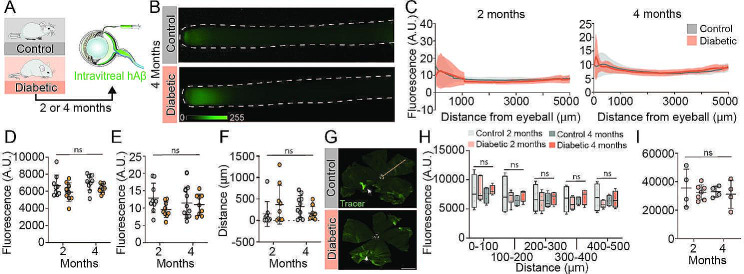
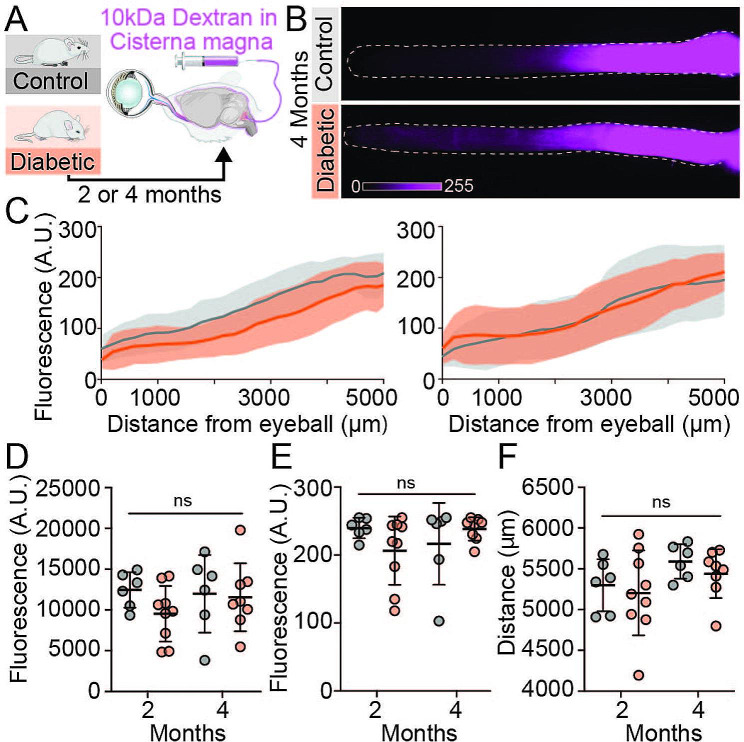
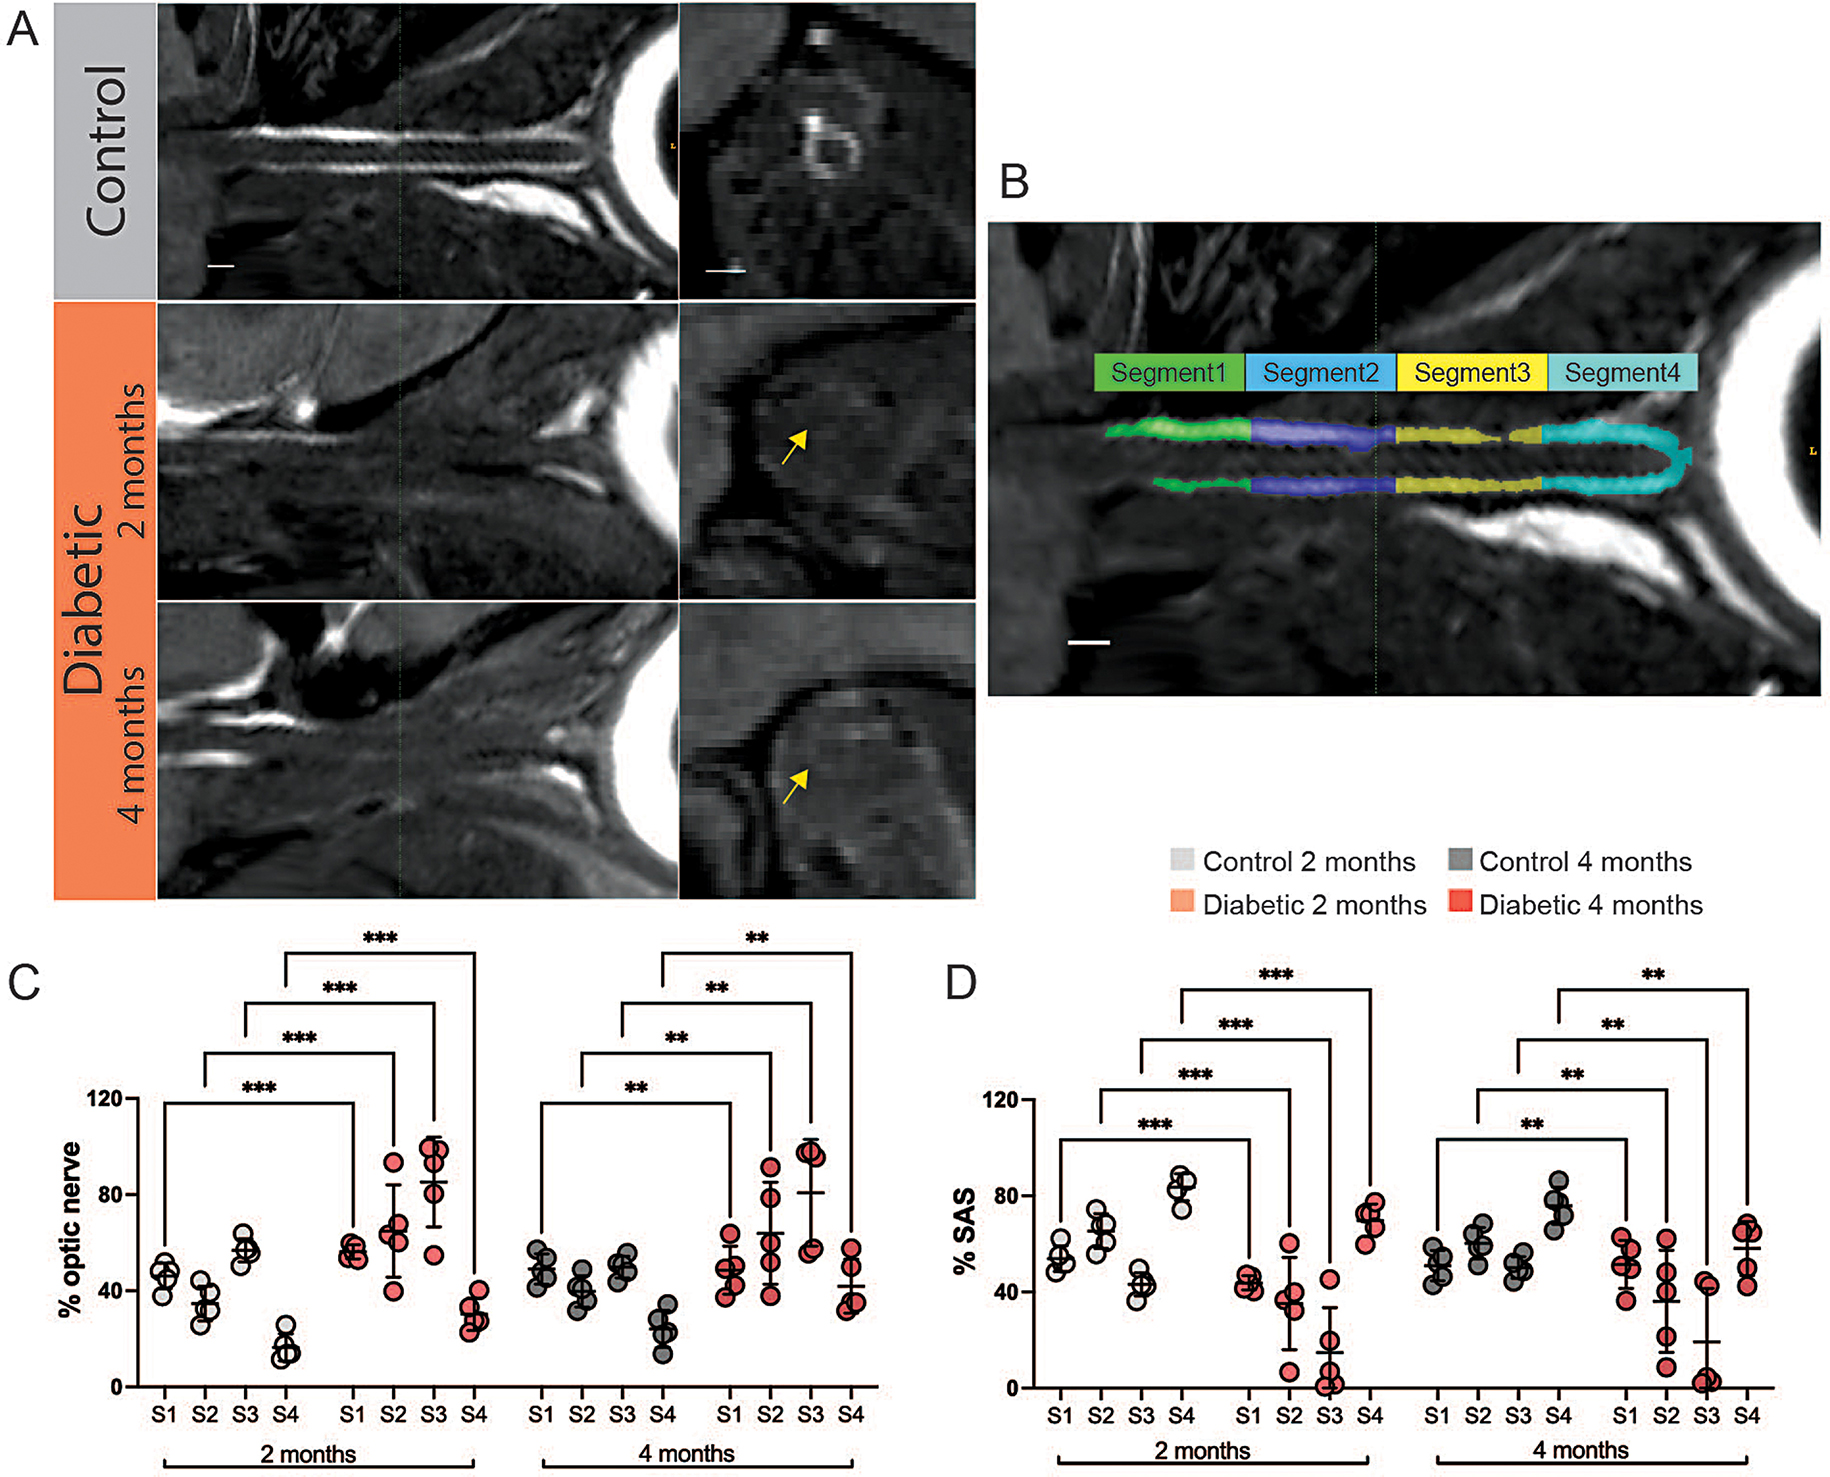
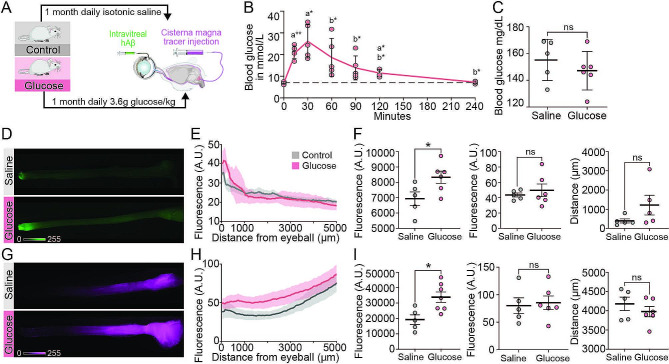
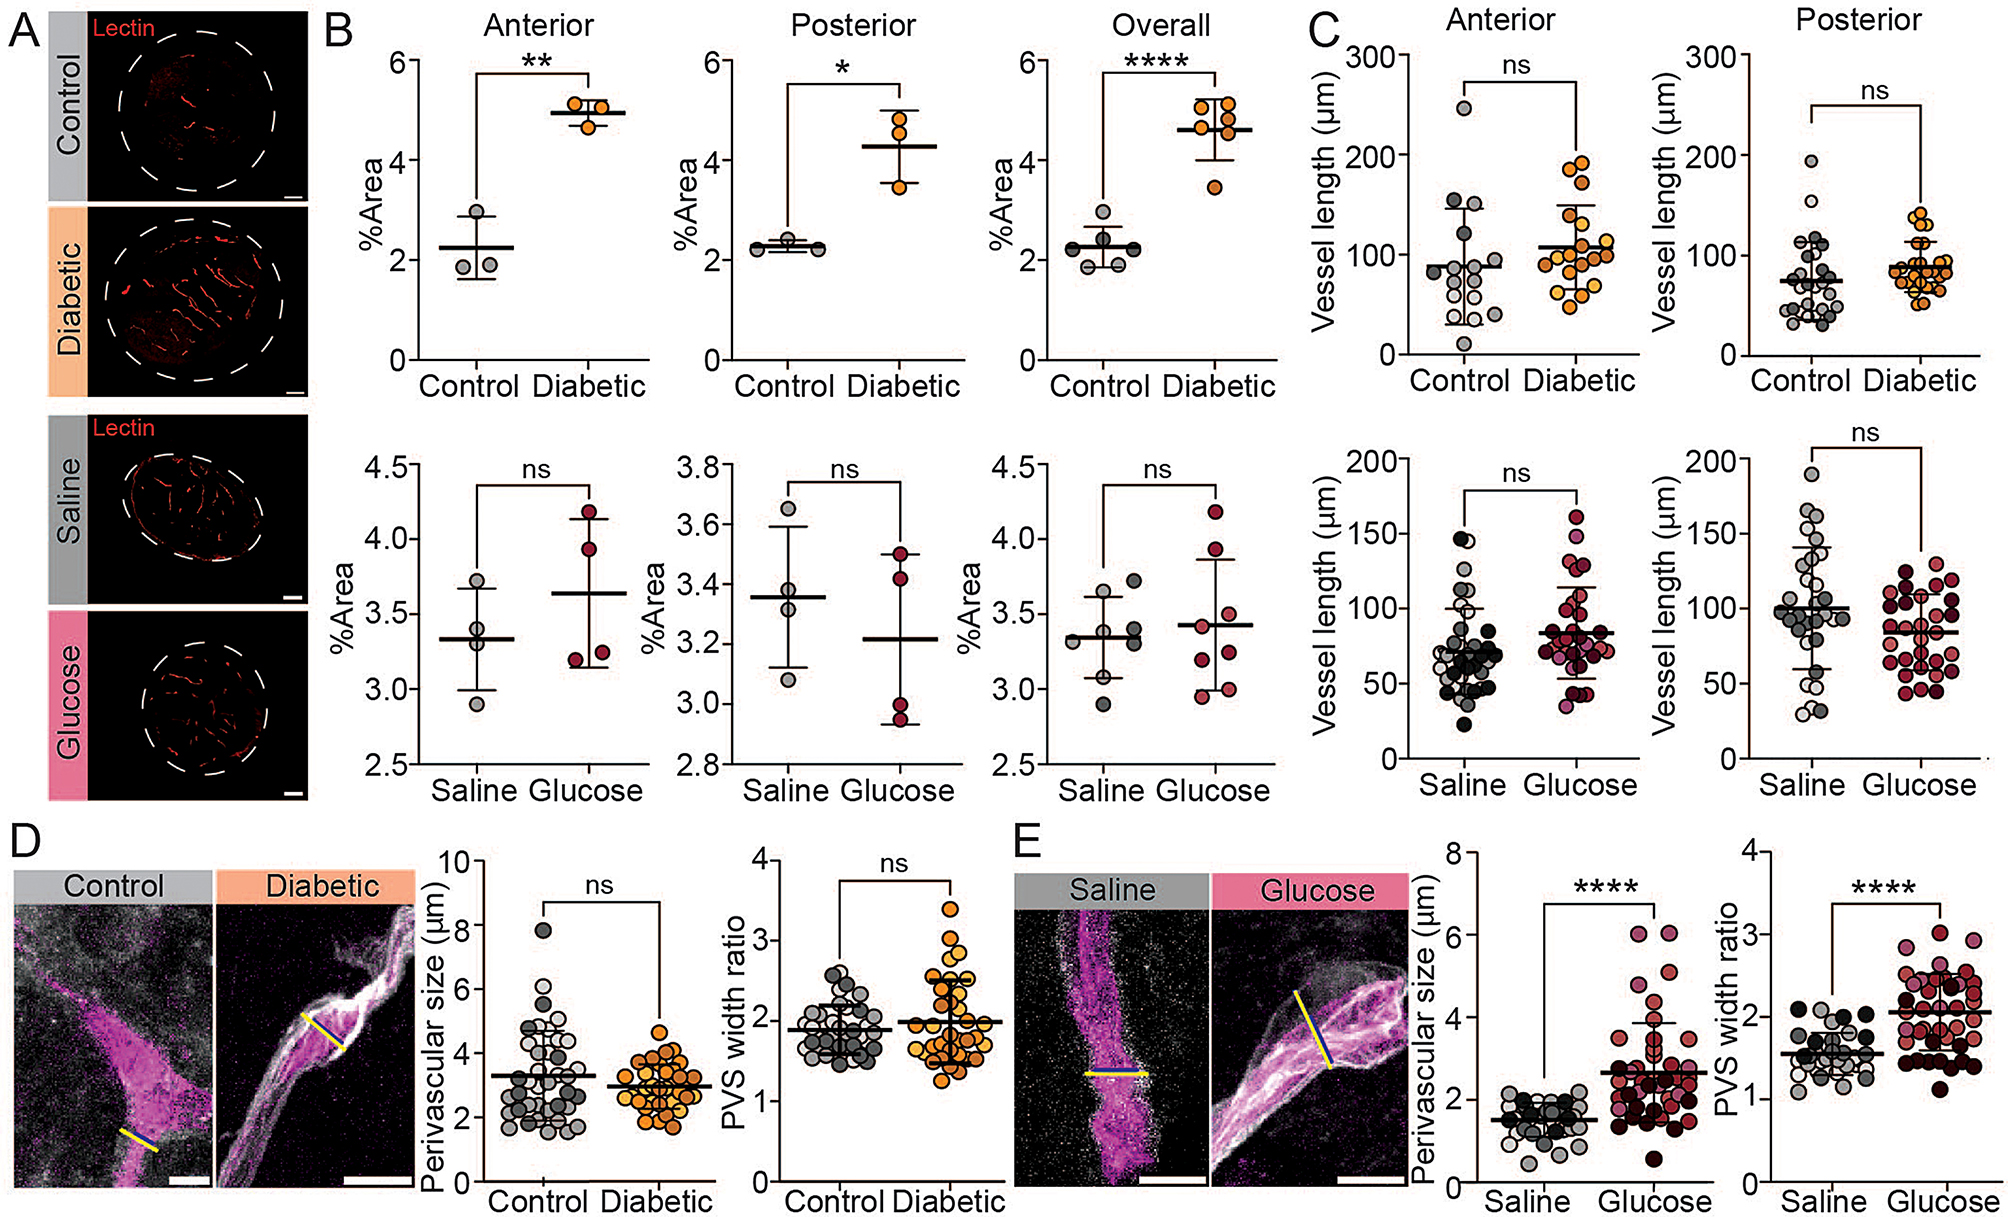
Glymphatic transport is vital for the physiological homeostasis of the retina and optic nerve. Pathological alterations of ocular glymphatic fluid transport and enlarged perivascular spaces have been described in glaucomatous mice. It remains to be established how diabetic retinopathy, which impairs vision in about 50% of diabetes patients, impacts ocular glymphatic fluid transport. Here, we examined ocular glymphatic transport in chronic hyperglycemic diabetic mice as well as in healthy mice experiencing a daily transient increase in blood glucose. Mice suffering from severe diabetes for two and four months, induced by streptozotocin, exhibited no alterations in ocular glymphatic fluid transport in the optic nerve compared to age-matched, non-diabetic controls. In contrast, transient increases in blood glucose induced by repeated daily glucose injections in healthy, awake, non-diabetic mice accelerated antero- and retrograde ocular glymphatic transport. Structural analysis showed enlarged perivascular spaces in the optic nerves of glucose-treated mice, which were absent in diabetic mice. Thus, transient repeated hyperglycemic events, but not constant hyperglycemia, ultimately enlarge perivascular spaces in the murine optic nerve. These findings indicate that fluid transport in the mouse eye is vulnerable to fluctuating glycemic levels rather than constant hyperglycemia, suggesting that poor glycemic control drives glymphatic malfunction and perivascular enlargement in the optic nerve.

Keywords: Cerebrospinal fluid; Diabetes; Glial lamina; Magnetic resonance imaging; Ocular glymphatic system; Perivascular spaces; Retina; Retinal ganglion cells; electron microscopy.


Conflict of interest statement

The authors declare no competing interests.

Figures

Fig. 1
Fig. 1
Ocular glymphatic clearance is unaltered in diabetic CD1 mice. (A) Schematic diagram of experimental approach. (B) Representative macroscopic images of optic nerves from control and diabetic mice four months after sham or STZ injection. (C) Total tracer signal over the entire length of the optic nerve at two and four months after onset of STZ-induced diabetes, with subtraction of background fluorescence of the contralateral non-injected control optic nerve (n = 9–10). (D) Plot of total tracer signal (arbitrary units (A.U.)), (E) peak signal intensity (A.U.), and (F) peak signal travel distance (µm). n = 9–10, ns = P > 0.05 between indicated groups by two-way ANOVA with Tukey’s correction (D-F). (G) Representative retina wholemounts imaged by epifluorescent microscopy for quantitation of tracer distribution. White circle– retina center, white arrow– site of intravitreal injection, orange line– example of drawn line ROI. Scale bar 1 mm. (H) Total tracer signal (A.U.) in control and diabetic retinas of the two- and four-month time points for different segments of the retina (distance ascending from retina center in µm). (I) Total tracer signal (A.U.) for whole retinas of two- and four-month diabetic and control mice. H + I) n = 4–7, ns = P > 0.05 between indicated groups by two-way ANOVA with Tukey’s correction. All graphs show mean ± SD
Fig. 2
Fig. 2
Ocular glymphatic CSF influx along the optic nerve remains unchanged in diabetic mice. (A) Experimental design of CSF tracer distribution in the optic nerve after intracisternal tracer injection. (B) Representative macroscopic images of CSF tracer distribution along optic nerves of four-month diabetic or control mice. (C) Distribution of CM-injected tracer depicting glymphatic CSF influx along the entire optic nerves (distance ascending from anterior to posterior) Left: two-months, right: four-month time point after onset of STZ diabetes (n = 6–9). (D) Total CM tracer signal in the optic nerve, (E) peak signal intensity and (F) peak signal distance travelled. Distance ascending from eyeball. n = 6–9, ns = P > 0.05 between indicated groups by two-way ANOVA with Tukey’s correction. All graphs show mean ± SD
Fig. 3
Fig. 3
Glial lamina integrity remains unaltered in diabetic mice. (A) Schematic diagram illustrating the experimental approach to evaluate the integrity of the glial lamina using intravitreally administered dextran tracer. (B) Representative macroscopic images of optic nerves after dextran tracer injection into the vitreous humor. The image brightness was increased to show the optic nerve outlined by the high autofluorescence signal. (C) Total tracer signal over the entire length of the optic nerve at two (left) and four (right) months after onset of diabetes (n = 5–6). (D) Plot of total fluorescent tracer signal (A.U.), (E) peak signal intensity and (F) peak signal travel distance. Distance ascending from the eyeball. N = 5–6, ns = P > 0.05 between indicated groups by two-way ANOVA with Tukey’s correction (D-F). (G) Representative confocal images of retina cross sections showing the optic nerve head region and dextran tracer (3 kDa) distribution. White dashed line indicates glial lamina region. Scale bar 50 μm. (H) Standard TEM images of glial lamina in cross section. Scale bar 10 μm, n = 2. All graphs show mean ± SD
Fig. 4
Fig. 4
In vivo magnetic resonance imaging revealing reduced CSF space in diabetic optic nerves. (A) Representative curved planar reconstruction of the optic nerve of representative control (4 months) and diabetic mice at two- or four-months after sham or STZ injection. Left: Longitudinal view, right: Cross section view. Green line indicate location of represented cross section view. Yellow arrow indicates diminished CSF filled subarachnoid space (SAS) in diabetic optic nerves. Scale bar: 200 μm. (B) Segmentation of the optic nerve into four segments of equal length: Segment 1 posterior pre-chiasmatic optic nerve part, segments 2 and 3: middle parts of the optic nerve, segment 4: anterior optic nerve part behind the orbit. C + D) Diagrams show the occupation rate (%) of the optic nerves (C) and the CSF-filled SAS (D) for each segment. n = 5, ***P ≤ 0.001, **P ≤ 0.01 between indicated groups by two-way ANOVA with Tukey’s correction. All graphs show mean ± SD
Fig. 5
Fig. 5
Repeated glucose challenge leads to abnormal glymphatic fluid transport in optic nerve of healthy mice. (A) Schematic of daily (except weekends) intraperitoneal administration of 1 M glucose solution or isotonic saline in healthy mice over a month followed by intravitreal (ITV) and cisterna magna (CM) injection of glymphatic-relevant tracers. (B) Representative plot of transient change of blood glucose levels in healthy awake mice after intraperitoneal injection of glucose (n = 5). One-way ANOVA, repeated measures with Geisser-Greenhouse correction. Significant differences to baseline (t = 0 min) indicated with the letter a. Significant differences to peak value (t = 30 min) indicated by letter b with *P ≤ 0.05. (C) Blood glucose levels of awake mice directly prior to undergoing the final experiment of intravitreal and intracisternal tracer injection (n = 5–6). Unpaired two-tailed t-test with Welch’s correction, ns = P > 0.05. (D-G) Representative macroscopic image of intravitreally (D) and intracisternally (G) injected tracer distributions along the optic nerve. EH) Average total tracer signal intensity over the entire length of the optic nerve (arbitrary units (A.U.), distance (µm) ascending from anterior to posterior) of ITV (E) and CM injected tracer (H). F-I) Total tracer signal intensity of entire optic nerves (left), tracer peak signal (middle), peak distance travelled (µm, ascending from anterior to posterior) (right) for ITV (F) and CM (I) injected tracer (n = 5–7). (F-I) Unpaired two-tailed t-test with Welch’s correction. *P ≤ 0.05 and ns = P > 0.05. All graphs show mean ± SD
Fig. 6
Fig. 6
Diabetes increases optic nerve vascularization, while repeated glucose challenge enlarges PVS in the optic nerve. (A) Representative images of lectin-stained vasculature in optic nerve cross sections from groups of four-month diabetic and control mice (top) and one-month glucose or saline injected mice (bottom). Scale bar: 50 μm. (B) Percentage of lectin-positive stained area in optic nerve cross sections for anterior (first 100 μm behind orbit) (left) and posterior (4–5 mm behind orbit) (right) optic nerve sections (n = 3–4 mice, 1 data point = average of 2–4 analyzed cross sections). Right hand graphs represent the summary for anterior and posterior sections. (C) Blood vessel length (µm) measured in optic nerve cross sections at different segments (control/diabetic: n(anterior) = 16–18, n(posterior) = 26–27; saline/glucose: n(anterior) = 31–37, n(posterior) = 30). (D-E) Measurement of perivascular size in optic nerve cross sections of four-month diabetic and control mice (D) and for one-month glucose of saline-injected healthy mice (E), along with representative images (scale bar: 5 μm). Perivascular space size was calculated by subtracting lectin signal diameter (blue line ROIs) from the tracer signal diameter (yellow line ROIs) (left graphs), and width ratio calculated by diving tracer signal diameter with lectin signal diameter, thus normalizing for different vessel sizes (right graphs); (n(control/diabetic) = 34–39, n(saline/glucose) = 35–42; 3–4 different animals). (C-E) Color gradings indicate single mice. B) Unpaired two-tailed t-test with Welch’s correction; (C-E) Linear mixed-effects model. ****P ≤ 0.0001, **P ≤ 0.01, ns = P > 0.05. All graphs show mean ± SD

Similar articles

Cited by

References

    1. Miao Y, Guo D, Li W, Zhong Y. Diabetes promotes development of Alzheimer’s Disease through suppression of Autophagy. J Alzheimer’s Disease. 2019;69:289–96. doi: 10.3233/JAD-190156. - DOI - PubMed
    1. Lee HJ, Seo HI, Cha HY, Yang YJ, Kwon SH, Yang SJ. Diabetes and Alzheimer’s Disease: Mechanisms and Nutritional Aspects. Clin Nutr Res [Internet]. 2018/10/23. 2018;7:229–40. Available from: https://pubmed.ncbi.nlm.nih.gov/30406052. - PMC - PubMed
    1. Timperley WR, Boulton AJ, Davies-Jones GA, Jarratt JA, Ward JD. Small vessel disease in progressive diabetic neuropathy associated with good metabolic control. J Clin Pathol. 1985;38:1030–8. doi: 10.1136/jcp.38.9.1030. - DOI - PMC - PubMed
    1. Umemura T, Kawamura T, Hotta N. Pathogenesis and neuroimaging of cerebral large and small vessel disease in type 2 diabetes: a possible link between cerebral and retinal microvascular abnormalities. J Diabetes Investig. 2017;8:134–48. doi: 10.1111/jdi.12545. - DOI - PMC - PubMed
    1. Barrett EJ, Liu Z, Khamaisi M, King GL, Klein R, Klein BEK, et al. Diabetic Microvascular Disease: an endocrine Society Scientific Statement. J Clin Endocrinol Metab. 2017;102:4343–410. doi: 10.1210/jc.2017-01922. - DOI - PMC - PubMed