

Survival time prediction in patients with high-grade serous ovarian cancer based on 18F-FDG PET/CT- derived inter-tumor heterogeneity metrics
- PMID: 38475819
- PMCID: PMC10936071
- DOI: 10.1186/s12885-024-12087-y
Survival time prediction in patients with high-grade serous ovarian cancer based on 18F-FDG PET/CT- derived inter-tumor heterogeneity metrics
Abstract
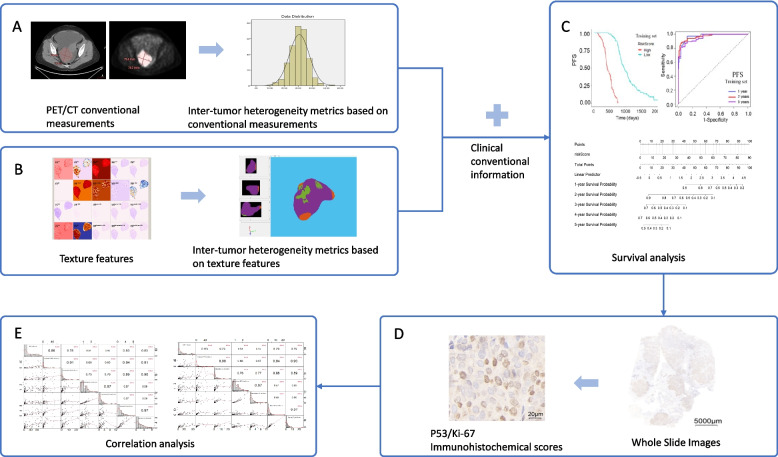
Background: The presence of heterogeneity is a significant attribute within the context of ovarian cancer. This study aimed to assess the predictive accuracy of models utilizing quantitative 18F-FDG PET/CT derived inter-tumor heterogeneity metrics in determining progression-free survival (PFS) and overall survival (OS) in patients diagnosed with high-grade serous ovarian cancer (HGSOC). Additionally, the study investigated the potential correlation between model risk scores and the expression levels of p53 and Ki-67.
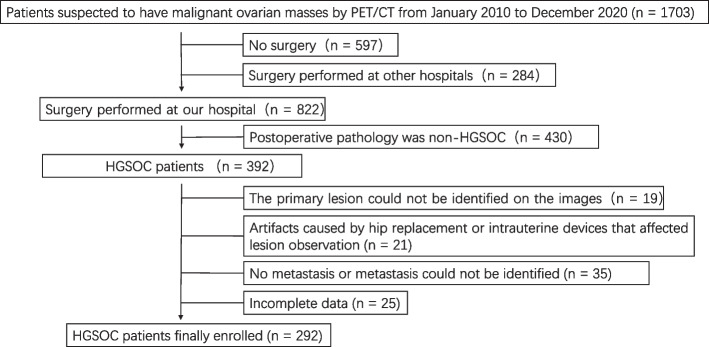
Methods: A total of 292 patients diagnosed with HGSOC were retrospectively enrolled at Shengjing Hospital of China Medical University (median age: 54 ± 9.4 years). Quantitative inter-tumor heterogeneity metrics were calculated based on conventional measurements and texture features of primary and metastatic lesions in 18F-FDG PET/CT. Conventional models, heterogeneity models, and integrated models were then constructed to predict PFS and OS. Spearman's correlation coefficient (ρ) was used to evaluate the correlation between immunohistochemical scores of p53 and Ki-67 and model risk scores.
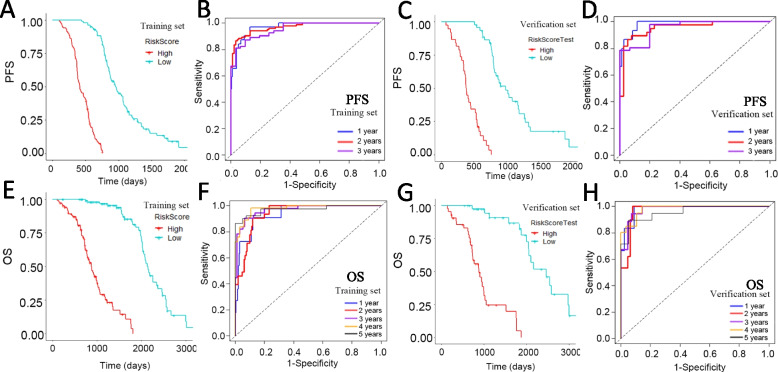
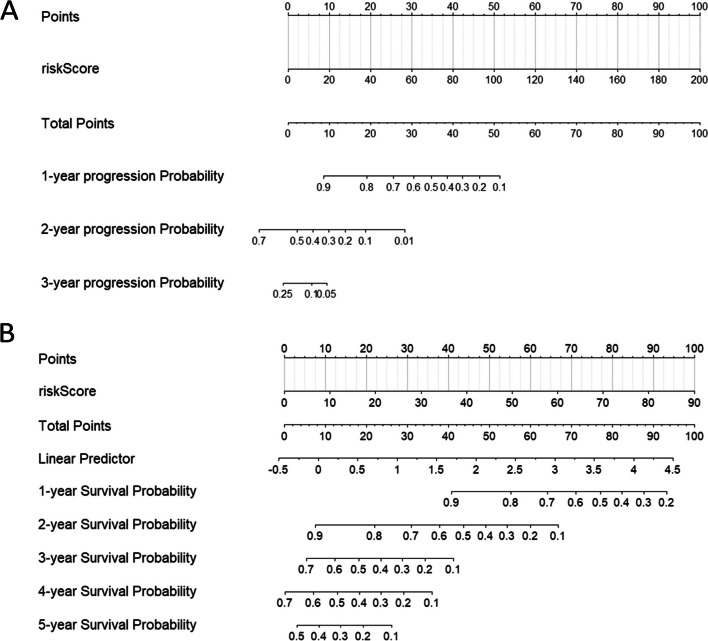
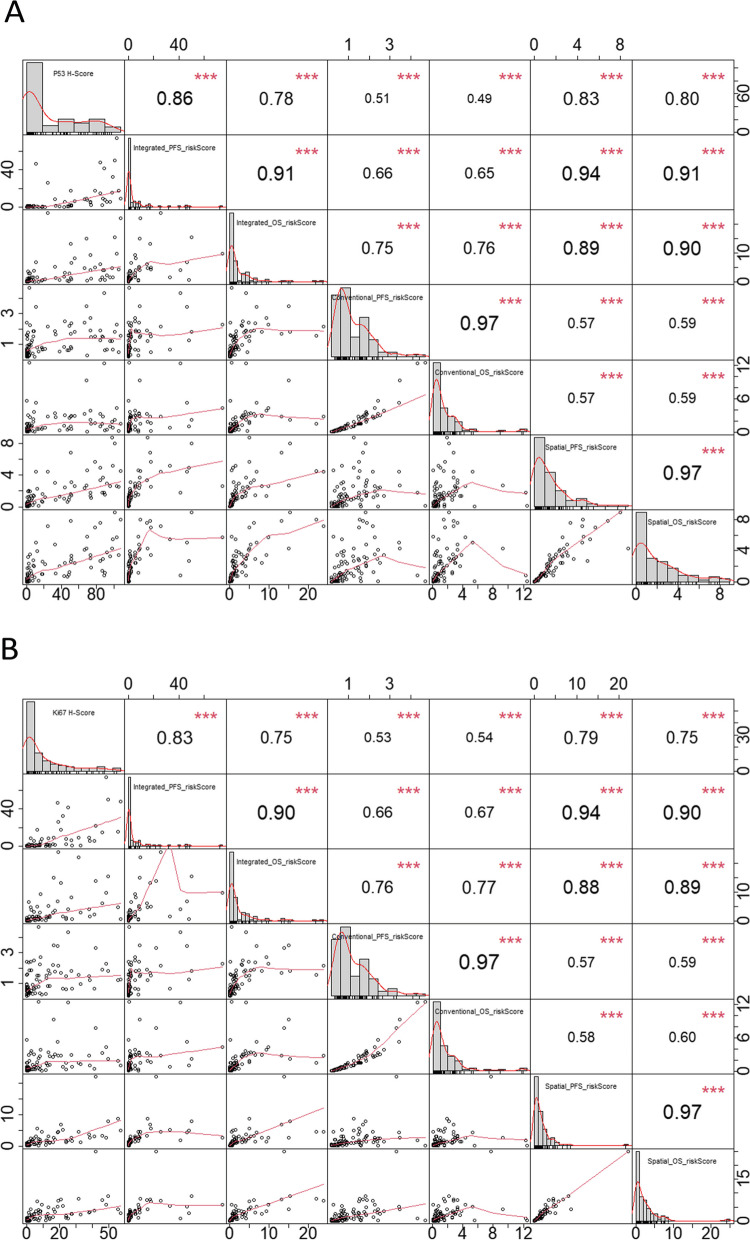
Results: The C-indices of the integrated models were the highest for both PFS and OS models. The C-indices of the training set and testing set of the integrated PFS model were 0.898 (95% confidence interval [CI]: 0.881-0.914) and 0.891 (95% CI: 0.860-0.921), respectively. For the integrated OS model, the C-indices of the training set and testing set were 0.894 (95% CI: 0.871-0.917) and 0.905 (95% CI: 0.873-0.936), respectively. The integrated PFS model showed the strongest correlation with the expression levels of p53 (ρ = 0.859, p < 0.001) and Ki-67 (ρ = 0.829, p < 0.001).
Conclusions: The models based on 18F-FDG PET/CT quantitative inter-tumor heterogeneity metrics exhibited good performance for predicting the PFS and OS of patients with HGSOC. p53 and Ki-67 expression levels were strongly correlated with the risk scores of the integrated predictive models.
Keywords: Computed tomography; Heterogeneity; High-grade serous ovarian cancer; Positron emission tomography; Prognosis.
© 2024. The Author(s).
Conflict of interest statement
The authors declare no competing interests.
Figures
Similar articles
-
18F-Fluoro-2-Deoxyglucose Positron Emission Tomography/Computed Tomography Measures of Spatial Heterogeneity for Predicting Platinum Resistance of High-Grade Serous Ovarian Cancer.Cancer Med. 2024 Oct;13(20):e70287. doi: 10.1002/cam4.70287. Cancer Med. 2024. PMID: 39435561 Free PMC article.
-
18F-fluorodeoxyglucose positron emission tomography in patients with recurrent ovarian cancer: in comparison with vascularity, Ki-67, p53, and histologic grade.Eur Radiol. 2007 Feb;17(2):409-17. doi: 10.1007/s00330-006-0326-y. Epub 2006 Jun 20. Eur Radiol. 2007. PMID: 16786320
-
Prognostic role of baseline 18 F-FDG PET/CT parameters in MALT lymphoma.Hematol Oncol. 2019 Feb;37(1):39-46. doi: 10.1002/hon.2563. Epub 2018 Nov 8. Hematol Oncol. 2019. PMID: 30299563
-
Post-transplantation Fluorine-18 Fluorodeoxyglucose Positron Emission Tomography in Patients with Lymphoblastic Lymphoma is an Independent Prognostic Factor with an Impact on Progression-Free Survival but not Overall Survival.Technol Cancer Res Treat. 2021 Jan-Dec;20:15330338211056478. doi: 10.1177/15330338211056478. Technol Cancer Res Treat. 2021. PMID: 34806464 Free PMC article.
-
18F-FDG PET/CT can predict chemosensitivity and proliferation of epithelial ovarian cancer via SUVmax value.Jpn J Radiol. 2018 Sep;36(9):544-550. doi: 10.1007/s11604-018-0755-y. Epub 2018 Jun 25. Jpn J Radiol. 2018. PMID: 29943313
Cited by
-
mpMRI-based habitat analysis for predicting prognoses in patients with high-grade serous ovarian cancer: a multicenter study.Abdom Radiol (NY). 2025 May 29. doi: 10.1007/s00261-025-05004-9. Online ahead of print. Abdom Radiol (NY). 2025. PMID: 40439719
-
CCL26 as a prognostic biomarker in hepatocellular carcinoma: integrating bioinformatics analysis, clinical validation, and radiomics score.Discov Oncol. 2025 Apr 9;16(1):502. doi: 10.1007/s12672-025-02280-1. Discov Oncol. 2025. PMID: 40205283 Free PMC article.
-
18F-Fluoro-2-Deoxyglucose Positron Emission Tomography/Computed Tomography Measures of Spatial Heterogeneity for Predicting Platinum Resistance of High-Grade Serous Ovarian Cancer.Cancer Med. 2024 Oct;13(20):e70287. doi: 10.1002/cam4.70287. Cancer Med. 2024. PMID: 39435561 Free PMC article.
References
MeSH terms
Substances
LinkOut - more resources
Full Text Sources
Medical
Research Materials
Miscellaneous
