Amyloid β oligomer induces cerebral vasculopathy via pericyte-mediated endothelial dysfunction
- PMID: 38475929
- PMCID: PMC10935813
- DOI: 10.1186/s13195-024-01423-w
Amyloid β oligomer induces cerebral vasculopathy via pericyte-mediated endothelial dysfunction
Abstract
Background: Although abnormal accumulation of amyloid beta (Aβ) protein is thought to be the main cause of Alzheimer's disease (AD), emerging evidence suggests a pivotal vascular contribution to AD. Aberrant amyloid β induces neurovascular dysfunction, leading to changes in the morphology and function of the microvasculature. However, little is known about the underlying mechanisms between Aβ deposition and vascular injuries. Recent studies have revealed that pericytes play a substantial role in the vasculopathy of AD. Additional research is imperative to attain a more comprehensive understanding.
Methods: Two-photon microscopy and laser speckle imaging were used to examine cerebrovascular dysfunction. Aβ oligomer stereotactic injection model was established to explain the relationship between Aβ and vasculopathy. Immunofluorescence staining, western blot, and real-time PCR were applied to detect the morphological and molecular alternations of pericytes. Primary cultured pericytes and bEnd.3 cells were employed to explore the underlying mechanisms.
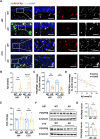
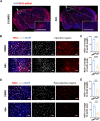
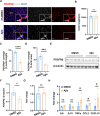
Results: Vasculopathy including BBB damage, hypoperfusion, and low vessel density were found in the cortex of 8 to 10-month-old 5xFAD mice. A similar phenomenon accompanied by pericyte degeneration appeared in an Aβ-injected model, suggesting a direct relationship between Aβ and vascular dysfunction. Pericytes showed impaired features including low PDGFRβ expression and increased pro-inflammatory chemokines secretion under the administration of Aβ in vitro, of which supernatant cultured with bEND.3 cells led to significant endothelial dysfunction characterized by TJ protein deficiency.
Conclusions: Our results provide new insights into the pathogenic mechanism underlying Aβ-induced vasculopathy. Targeting pericyte therapies are promising to ameliorate vascular dysfunction in AD.
Keywords: Alzheimer’s disease; Aβ oligomer; Blood–brain barrier (BBB); Pericytes; Tight junction proteins.
© 2024. The Author(s).
Conflict of interest statement
The authors declare no competing interests.
Figures


Similar articles
-
Identification of early pericyte loss and vascular amyloidosis in Alzheimer's disease retina.Acta Neuropathol. 2020 May;139(5):813-836. doi: 10.1007/s00401-020-02134-w. Epub 2020 Feb 10. Acta Neuropathol. 2020. PMID: 32043162 Free PMC article.
-
Neurovascular mechanisms and blood-brain barrier disorder in Alzheimer's disease.Acta Neuropathol. 2009 Jul;118(1):103-13. doi: 10.1007/s00401-009-0522-3. Epub 2009 Mar 25. Acta Neuropathol. 2009. PMID: 19319544 Free PMC article. Review.
-
Blood-Brain Barrier Dysfunction and the Pathogenesis of Alzheimer's Disease.Int J Mol Sci. 2017 Sep 13;18(9):1965. doi: 10.3390/ijms18091965. Int J Mol Sci. 2017. PMID: 28902142 Free PMC article. Review.
-
Pathological changes within the cerebral vasculature in Alzheimer's disease: New perspectives.Brain Pathol. 2022 Nov;32(6):e13061. doi: 10.1111/bpa.13061. Epub 2022 Mar 14. Brain Pathol. 2022. PMID: 35289012 Free PMC article. Review.
-
Interactions between Beta-Amyloid and Pericytes in Alzheimer's Disease.Front Biosci (Landmark Ed). 2024 Apr 2;29(4):136. doi: 10.31083/j.fbl2904136. Front Biosci (Landmark Ed). 2024. PMID: 38682184 Review.
Cited by
-
Multi-omics in exploring the pathophysiology of diabetic retinopathy.Front Cell Dev Biol. 2024 Dec 11;12:1500474. doi: 10.3389/fcell.2024.1500474. eCollection 2024. Front Cell Dev Biol. 2024. PMID: 39723239 Free PMC article. Review.
-
Emerging biophysical origins and pathogenic implications of amyloid oligomers.Nat Commun. 2025 Mar 26;16(1):2937. doi: 10.1038/s41467-025-58335-y. Nat Commun. 2025. PMID: 40133283 Free PMC article. Review.
-
Clearing Amyloid-Beta by Astrocytes: The Role of Rho GTPases Signaling Pathways as Potential Therapeutic Targets.Brain Sci. 2024 Dec 10;14(12):1239. doi: 10.3390/brainsci14121239. Brain Sci. 2024. PMID: 39766438 Free PMC article. Review.
-
Engineering blood-brain barrier microphysiological systems to model Alzheimer's disease monocyte penetration and infiltration.Biomater Sci. 2025 Jun 25;13(13):3650-3661. doi: 10.1039/d5bm00204d. Biomater Sci. 2025. PMID: 40391576
-
Latest Perspectives on Alzheimer's Disease Treatment: The Role of Blood-Brain Barrier and Antioxidant-Based Drug Delivery Systems.Molecules. 2024 Aug 27;29(17):4056. doi: 10.3390/molecules29174056. Molecules. 2024. PMID: 39274904 Free PMC article. Review.
References
-
- 2023 Alzheimer's disease facts and figures. Alzheimers Dement. 2023;19(4):1598–695. - PubMed
-
- Raina P, Santaguida P, Ismaila A, Patterson C, Cowan D, Levine M, et al. Effectiveness of cholinesterase inhibitors and memantine for treating dementia: evidence review for a clinical practice guideline. Ann Intern Med. 2008;148(5):379–397. doi: 10.7326/0003-4819-148-5-200803040-00009. - DOI - PubMed
Publication types
MeSH terms
Substances
Supplementary concepts
Grants and funding
- 2022A1515012396/Natural Science Foundation of Guangdong Province
- 2021A1515111102/Guangdong Basic and Applied Basic Research Foundation
- 82304067/National Natural Science Foundation of China
- 81925031, 81820108026/National Natural Science Foundation of China
- 202007030001/Guangzhou Science and Technology Program key projects
LinkOut - more resources
Full Text Sources
Medical

