Endothelial-specific telomerase inactivation causes telomere-independent cell senescence and multi-organ dysfunction characteristic of aging
- PMID: 38475941
- PMCID: PMC11296101
- DOI: 10.1111/acel.14138
Endothelial-specific telomerase inactivation causes telomere-independent cell senescence and multi-organ dysfunction characteristic of aging
Abstract
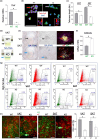
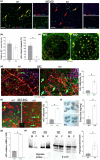
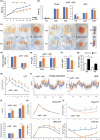
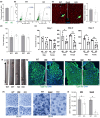
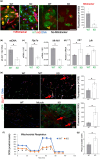
It has remained unclear how aging of endothelial cells (EC) contributes to pathophysiology of individual organs. Cell senescence results in part from inactivation of telomerase (TERT). Here, we analyzed mice with Tert knockout specifically in EC. Tert loss in EC induced transcriptional changes indicative of senescence and tissue hypoxia in EC and in other cells. We demonstrate that EC-Tert-KO mice have leaky blood vessels. The blood-brain barrier of EC-Tert-KO mice is compromised, and their cognitive function is impaired. EC-Tert-KO mice display reduced muscle endurance and decreased expression of enzymes responsible for oxidative metabolism. Our data indicate that Tert-KO EC have reduced mitochondrial content and function, which results in increased dependence on glycolysis. Consistent with this, EC-Tert-KO mice have metabolism changes indicative of increased glucose utilization. In EC-Tert-KO mice, expedited telomere attrition is observed for EC of adipose tissue (AT), while brain and skeletal muscle EC have normal telomere length but still display features of senescence. Our data indicate that the loss of Tert causes EC senescence in part through a telomere length-independent mechanism undermining mitochondrial function. We conclude that EC-Tert-KO mice is a model of expedited vascular senescence recapitulating the hallmarks aging, which can be useful for developing revitalization therapies.
Keywords: accelerated aging; endothelial; hypoxia; knockout; metabolism; mitochondrial disease; senescence; telomerase.
© 2024 The Authors. Aging Cell published by Anatomical Society and John Wiley & Sons Ltd.
Conflict of interest statement
The authors declare no conflict of interest.
Figures

Similar articles
-
Caloric Restriction and Telomere Preservation in TERT Knockout Adipocyte Progenitors Does Not Rescue Mice From Metabolic Dysfunction due to a TERT Function in Adipocyte Mitochondria.Aging Cell. 2025 Mar;24(3):e14499. doi: 10.1111/acel.14499. Epub 2025 Feb 11. Aging Cell. 2025. PMID: 39932851 Free PMC article.
-
Senescence caused by telomerase inactivation in myeloid, mesenchymal, and endothelial cells has distinct effects on cancer progression.Aging (Albany NY). 2025 Jun 5;17(6):1452-1465. doi: 10.18632/aging.206268. Epub 2025 Jun 5. Aging (Albany NY). 2025. PMID: 40482194 Free PMC article.
-
Telomeres and Mitochondrial Metabolism: Implications for Cellular Senescence and Age-related Diseases.Stem Cell Rev Rep. 2022 Oct;18(7):2315-2327. doi: 10.1007/s12015-022-10370-8. Epub 2022 Apr 23. Stem Cell Rev Rep. 2022. PMID: 35460064 Free PMC article. Review.
-
Expression of telomerase reverse transcriptase positively correlates with duration of lithium treatment in bipolar disorder.Psychiatry Res. 2020 Apr;286:112865. doi: 10.1016/j.psychres.2020.112865. Epub 2020 Feb 11. Psychiatry Res. 2020. PMID: 32114208 Free PMC article.
-
Cellular functions of the dual-targeted catalytic subunit of telomerase, telomerase reverse transcriptase--potential role in senescence and aging.Exp Gerontol. 2014 Aug;56:189-93. doi: 10.1016/j.exger.2014.02.011. Epub 2014 Feb 28. Exp Gerontol. 2014. PMID: 24583100 Review.
Cited by
-
Caloric Restriction and Telomere Preservation in TERT Knockout Adipocyte Progenitors Does Not Rescue Mice From Metabolic Dysfunction due to a TERT Function in Adipocyte Mitochondria.Aging Cell. 2025 Mar;24(3):e14499. doi: 10.1111/acel.14499. Epub 2025 Feb 11. Aging Cell. 2025. PMID: 39932851 Free PMC article.
-
Role of Nutritional Elements in Skin Homeostasis: A Review.Biomolecules. 2025 Jun 3;15(6):808. doi: 10.3390/biom15060808. Biomolecules. 2025. PMID: 40563448 Free PMC article. Review.
-
Endothelial TERT drives microvascular phenotype associated with coronary artery disease.Am J Physiol Heart Circ Physiol. 2025 Jul 1;329(1):H267-H270. doi: 10.1152/ajpheart.00342.2025. Epub 2025 Jun 13. Am J Physiol Heart Circ Physiol. 2025. PMID: 40514200 Free PMC article.
-
Induced Pluripotent Stem Cells-Based Regenerative Therapies in Treating Human Aging-Related Functional Decline and Diseases.Cells. 2025 Apr 21;14(8):619. doi: 10.3390/cells14080619. Cells. 2025. PMID: 40277944 Free PMC article. Review.
-
Telomeres in skin aging.Biogerontology. 2025 Mar 30;26(2):83. doi: 10.1007/s10522-025-10228-9. Biogerontology. 2025. PMID: 40159528 Review.
References
-
- Ait‐Aissa, K. , Norwood‐Toro, L. E. , Terwoord, J. , Young, M. , Paniagua, L. A. , Hader, S. N. , Hughes, W. E. , Hockenberry, J. C. , Beare, J. E. , Linn, J. , Kohmoto, T. , Kim, J. , Betts, D. H. , LeBlanc, A. J. , Gutterman, D. D. , & Beyer, A. M. (2022). Noncanonical role of telomerase in regulation of microvascular redox environment with implications for coronary artery disease. Function, 3, zqac043. 10.1093/function/zqac043 - DOI - PMC - PubMed
-
- Ale‐Agha, N. , Jakobs, P. , Goy, C. , Zurek, M. , Rosen, J. , Dyballa‐Rukes, N. , Metzger, S. , Greulich, J. , von Ameln, F. , Eckermann, O. , Unfried, K. , Brack, F. , Grandoch, M. , Thielmann, M. , Kamler, M. , Gedik, N. , Kleinbongard, P. , Heinen, A. , Heusch, G. , … Haendeler, J. (2021). Mitochondrial telomerase reverse transcriptase protects from myocardial ischemia/reperfusion injury by improving complex I composition and function. Circulation, 144, 1876–1890. 10.1161/CIRCULATIONAHA.120.051923 - DOI - PubMed
-
- Assmus, B. , Urbich, C. , Aicher, A. , Hofmann, W. K. , Haendeler, J. , Rossig, L. , Spyridopoulos, I. , Zeiher, A. M. , & Dimmeler, S. (2003). HMG‐CoA reductase inhibitors reduce senescence and increase proliferation of endothelial progenitor cells via regulation of cell cycle regulatory genes. Circulation Research, 92, 1049–1055. 10.1161/01.RES.0000070067.64040.7C - DOI - PubMed
Publication types
MeSH terms
Substances
Grants and funding
LinkOut - more resources
Full Text Sources
Medical
Research Materials

