. 2024 Mar 13;15(1):77.
doi: 10.1186/s13287-024-03683-7.

Transcriptomic and proteomic profiles of fetal versus adult mesenchymal stromal cells and mesenchymal stromal cell-derived extracellular vesicles

Affiliations

Transcriptomic and proteomic profiles of fetal versus adult mesenchymal stromal cells and mesenchymal stromal cell-derived extracellular vesicles

Emine Begüm Gençer et al. Stem Cell Res Ther. .

Abstract

Background: Mesenchymal stem/stromal cells (MSCs) can regenerate tissues through engraftment and differentiation but also via paracrine signalling via extracellular vesicles (EVs). Fetal-derived MSCs (fMSCs) have been shown, both in vitro and in animal studies, to be more efficient than adult MSC (aMSCs) in generating bone and muscle but the underlying reason for this difference has not yet been clearly elucidated. In this study, we aimed to systematically investigate the differences between fetal and adult MSCs and MSC-derived EVs at the phenotypic, RNA, and protein levels.

Methods: We carried out a detailed and comparative characterization of culture-expanded fetal liver derived MSCs (fMSCs) and adult bone marrow derived MSCs (aMSCs) phenotypically, and the MSCs and MSC-derived EVs were analysed using transcriptomics and proteomics approaches with RNA Sequencing and Mass Spectrometry.

Results: Fetal MSCs were smaller, exhibited increased proliferation and colony-forming capacity, delayed onset of senescence, and demonstrated superior osteoblast differentiation capability compared to their adult counterparts. Gene Ontology analysis revealed that fMSCs displayed upregulated gene sets such as "Positive regulation of stem cell populations", "Maintenance of stemness" and "Muscle cell development/contraction/Myogenesis" in comparison to aMSCs. Conversely, aMSCs displayed upregulated gene sets such as "Complement cascade", "Adipogenesis", "Extracellular matrix glycoproteins" and "Cellular metabolism", and on the protein level, "Epithelial cell differentiation" pathways. Signalling entropy analysis suggested that fMSCs exhibit higher signalling promiscuity and hence, higher potency than aMSCs. Gene ontology comparisons revealed that fetal MSC-derived EVs (fEVs) were enriched for "Collagen fibril organization", "Protein folding", and "Response to transforming growth factor beta" compared to adult MSC-derived EVs (aEVs), whereas no significant difference in protein expression in aEVs compared to fEVs could be detected.

Conclusions: This study provides detailed and systematic insight into the differences between fMSCs and aMSCs, and MSC-derived EVs. The key finding across phenotypic, transcriptomic and proteomic levels is that fMSCs exhibit higher potency than aMSCs, meaning they are in a more undifferentiated state. Additionally, fMSCs and fMSC-derived EVs may possess greater bone forming capacity compared to aMSCs. Therefore, using fMSCs may lead to better treatment efficacy, especially in musculoskeletal diseases.

Keywords: Biosignature; Extracellular vesicles; Fetal mesenchymal stem cells; Mesenchymal stromal cells; Proteomic; Transcriptomic.


Conflict of interest statement

CG and LWJ are co-founders and co-owners of BOOST Pharma ApS. AG and SEA are consultants for and have equity interest in Evox Therapeutics. KLB is consultant for Swedish StromaBio AB. DWH, EBG, FA, MAT, MOG, MP, NS and YKL declare that they have no competing interests.

Figures

Fig. 1
Fig. 1
Characteristics of fMSCs and aMSCs. Representative morphologic images of (A) fMSCs and (B) aMSCs, respectively. (C) CASY TT measurement of the mean peak cell diameter of fMSCs and aMSCs (n = 3). (D) The mean number of population doublings (PD) that fMSCs and aMSCs achieved per passage between passage 5–8, and (E) The mean population doubling time (PDT) in hours for fMSCs and aMSCs over passage 5–8. Representative images of β-galactosidase expression in (F) fMSCs and (G) aMSCs at passage 8. The arrowheads indicate β-galactosidase positive cells (blue), n = 3. (H) The mean percentage of β-galactosidase positive cells in fMSCs and aMSCs at passage 8 (n = 3). (I) The mean colony forming unit fibroblast (CFU-F) capacity of fMSCs between passage 3–8, (adult MSCs did not have CFU-F capacity after passage 4), n = 3. Mean ± SD, *P < 0.05, **P < 0.01. Scale bars in (A, B, F, G) represents 200 μm
Fig. 2
Fig. 2
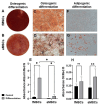
Differentiation of fMSCs and aMSCs into osteoblasts and adipocytes. Representative images of the whole 12-plate wells following Alizarin red S staining of calcium deposits in osteogenic induced MSCs; (A) fMSCs and (B) aMSCs. Representative microscopic images at 100× magnification of osteogenic induced and Alizarin red S stained (extracellular red staining) (C) fMSCs and (D) aMSCs. (E) Quantification of Alizarin red S staining of osteogenic differentiated and control fMSCs and aMSCs. Representative microscopic images at 100× magnification of (F) fMSCs and (G) aMSCs induced into adipocytes following Oil Red O staining (red intracellular lipid droplets). (H) Quantification of Oil Red O staining of adipogenic differentiated and control fMSCs and aMSCs. Two replicate experiments for each donor, n = 3 for fMSCs and aMSCs. Mean ± SD, *P < 0.05, **<0.01, ns = not significant
Fig. 3
Fig. 3
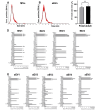
EV concentrations and surface marker expression on the isolated EVs. Nanoparticle tracking analysis (NTA) of extracellular vesicles (EVs), and quantification of proteins on the surface of the EVs by MACSPlex exosome assay. The mode size of (A) fetal EVs (fEVs) and (B) adult EVs (aEVs), as shown in the representative particle and average size distributions using NTA. The median APC fluorescence intensity values for each protein expressed in the EVs are shown. Averaged Size / Concentration Red lines indicate ± 1 standard deviation of the mean. (C) The mean EV mode size distribution of fetal and adult EVs. Surface detection of markers on (D) fEVs and (E) aEVs. Nine independent experiments were performed from each donor (n = 4 biological replicates of fEVs and n = 5 biological replicates of aEVs)
Fig. 4
Fig. 4
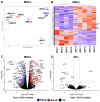
Comparison of the transcriptomes of fetal and adult MSCs and MSC-derived EVs. (A, B) Transcriptomics data distribution between fetal and adult MSCs. (A) Principal component analysis of fMSCs (blue dots, n = 4 donors) and aMSCs (red dots, n = 5 donors), (3 replicates from each fMSCs and aMSCs). (B) Hierarchal clustering dendrogram of fMSCs and aMSCs illustrating the distinctive donor-type specific transcriptomes. (C, D) Comparison of fetal and adult transcriptomes. Volcano plots of (C) MSCs and (D) EVs. Blue dots show significantly upregulated genes in 4 fMSCs and 3 fEVs and red dots show significantly upregulated genes in 5 aMSCs and aEVs. The coloured dots have adj-P < 0.01 and fold change > 2 (|log2 fc|>1). Black dots show detected non-significant (ns) differently expressed genes
Fig. 5
Fig. 5
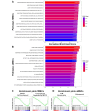
Gene Set Enrichment Analysis (GSEA) comparison of the biological processes’ pathways of fMSCs and aMSCs. (A, B) Bar chart of the top 15 significantly enriched pathways in fMSCs (A) and aMSCs (B). (C, D) Normalized enrichment plots of novel pathways/gene sets enriched in fMSCs (C) and aMSCs (D). The top part of each plot shows the enrichment score that represents running-sum statistic calculated by “walking down” the ranked list of genes. The green line represents the time-course gene expression data (the normalized enrichment score) and the vertical black lines indicate the position of the genes found in the target gene set within a gene list ranked by log2 fold changes. The Enrichment score is the maximum deviation from zero as calculated for each gene going down the ranked list and represents the degree of over-representation of a gene set at the top or the bottom of the ranked gene list. The coloured bar at the bottom of the plot shows positive (red) and negative (blue) correlation to phenotype in fMSCs and aMSCs (C, D)
Fig. 6
Fig. 6
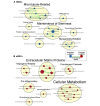
Enrichment maps of transcriptomic differences between fMSCs and aMSCs. Enrichment maps visualizing the gene set enrichment analysis comparing the transcriptomes of (A) fMSCs and (B) aMSCs using Cytoscape 3.9.1. Individual nodes represent an enriched gene set from C2 or C5 collections with FDR adj-P < 0.05. Blue node colour indicates enrichment in fMSCs and red node colour enrichment in aMSCs. The edges of connecting nodes with overlapping genes in different pathways and the thickness of the green lines reflects the magnitude of overlaps. Several nodes were manually clustered into the yellow circles and labelled to describe overarching biological themes
Fig. 7
Fig. 7
Signalling Entropy analysis of the transcriptomes of fMSCs and aMSCs. Signalling entropy rates obtained in SCENT. Fetal MSCs display statistically significant higher entropy compared to aMSCs (P = 0.032). Black nodes represent individual samples including technical replicates of biological samples (fMSCs = 4; aMSCs = 5, n = 3 replicates)
Fig. 8
Fig. 8
Expressed Proteins in MSCs and MSC-derived EVs. (A, B) Volcano plots of proteins in fetal and adult MSCs and MSC-derived EVs analysed by mass spectrometry. The volcano plots show detected proteins (n = 7607) in MSCs and EVs (n = 280). Blue (fetal) and red (adult) dots show significantly upregulated proteins in (A) MSCs (3 fMSCs and 5 aMSCs) and (B) EVs (4 fEVs and 5 aEVs). All coloured dots show statistically Differently Expressed Proteins (adj-P < 0.01 and |log2 fc| >1) in the MSCs and EVs. The number of proteins detected significantly different in fMSCs = 2 and aMSCs = 14 (A), and in fEVs = 44, none in aEVs (B). Black dots show non-significant (ns) differentially expressed proteins

Similar articles

Cited by

References

    1. Alvites R, Branquinho M, Sousa AC, Lopes B, Sousa P, Mauricio AC. Mesenchymal Stem/Stromal cells and their paracrine activity-immunomodulation mechanisms and how to influence the therapeutic potential. Pharmaceutics. 2022;14(2). - PMC - PubMed
    1. Alcaraz MJ, Compan A, Guillen MI. Extracellular vesicles from mesenchymal stem cells as novel treatments for Musculoskeletal diseases. Cells. 2019;9(1). - PMC - PubMed
    1. Phinney DG, Pittenger MF. Concise Review: MSC-Derived exosomes for cell-free therapy. Stem Cells. 2017;35(4):851–8. doi: 10.1002/stem.2575. - DOI - PubMed
    1. Heldring N, Mager I, Wood MJ, Le Blanc K, Andaloussi SE. Therapeutic potential of multipotent mesenchymal stromal cells and their extracellular vesicles. Hum Gene Ther. 2015;26(8):506–17. doi: 10.1089/hum.2015.072. - DOI - PubMed
    1. Zhang B, Tian X, Hao J, Xu G, Zhang W. Mesenchymal stem cell-derived extracellular vesicles in tissue regeneration. Cell Transpl. 2020;29:963689720908500. doi: 10.1177/0963689720908500. - DOI - PMC - PubMed

Publication types

LinkOut - more resources