. 2024 May;11(18):e2305852.
doi: 10.1002/advs.202305852. Epub 2024 Mar 12.

Human Fibroblast-Derived Matrix Hydrogel Accelerates Regenerative Wound Remodeling Through the Interactions with Macrophages

Affiliations

Human Fibroblast-Derived Matrix Hydrogel Accelerates Regenerative Wound Remodeling Through the Interactions with Macrophages

Cininta Savitri et al. Adv Sci (Weinh). 2024 May.

Abstract

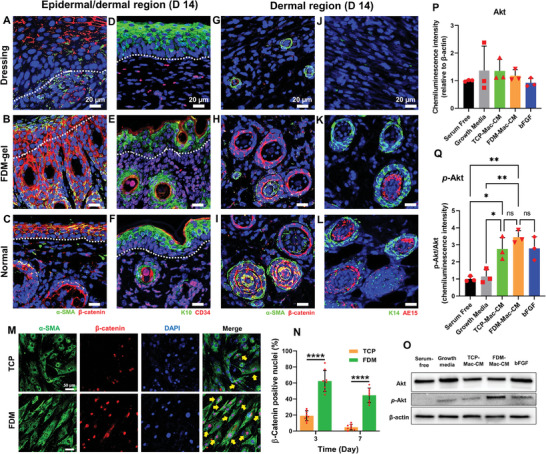
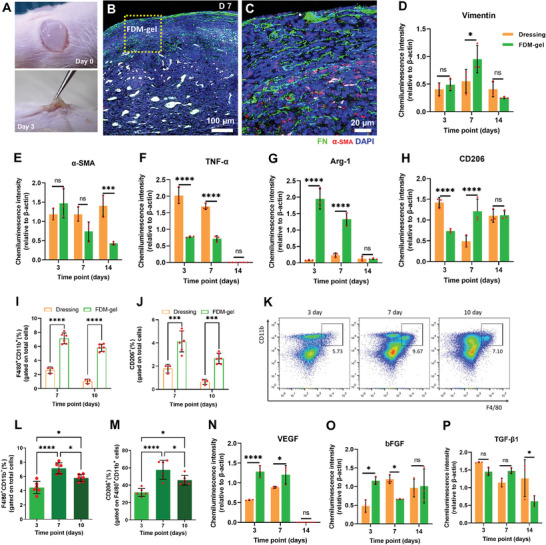
Herein, a novel extracellular matrix (ECM) hydrogel is proposed fabricated solely from decellularized, human fibroblast-derived matrix (FDM) toward advanced wound healing. This FDM-gel is physically very stable and viscoelastic, while preserving the natural ECM diversity and various bioactive factors. Subcutaneously transplanted FDM-gel provided a permissive environment for innate immune cells infiltration. Compared to collagen hydrogel, excellent wound healing indications of FDM-gel treated in the full-thickness wounds are noticed, particularly hair follicle formation via highly upregulated β-catenin. Sequential analysis of the regenerated wound tissues disclosed that FDM-gel significantly alleviated pro-inflammatory cytokine and promoted M2-like macrophages, along with significantly elevated vascular endothelial growth factor (VEGF) and basic fibroblast growth factor (bFGF) level. A mechanistic study demonstrated that macrophages-FDM interactions through cell surface integrins α5β1 and α1β1 resulted in significant production of VEGF and bFGF, increased Akt phosphorylation, and upregulated matrix metalloproteinase-9 activity. Interestingly, blocking such interactions using specific inhibitors (ATN161 for α5β1 and obtustatin for α1β1) negatively affected those pro-healing growth factors secretion. Macrophages depletion animal model significantly attenuated the healing effect of FDM-gel. This study demonstrates that the FDM-gel is an excellent immunomodulatory material that is permissive for host cells infiltration, resorbable with time, and interactive with macrophages, where it thus enables regenerative matrix remodeling toward a complete wound healing.

Keywords: cell‐derived, decellularized extracellular matrix; human fibroblast‐derived matrix hydrogel; macrophages; matrix‐macrophages interaction; wound healing.


Conflict of interest statement

The authors declare no conflict of interest.

Figures

Figure 1
Figure 1
Fabrication and characterization of FDM‐gel. A) Fabrication process of FDM‐gel. B) Appearance of the FDM‐gel and the one gripped by forceps. C) Microscopic view of FDM‐gel (Inset: immunofluorescence of fibronectin). D) Wet and dry weight of FDM‐gel. E) Surface texture of FDM‐gel as observed via SEM. F) Comparison of the functional groups between FDM (2D) and FDM‐gel (3D) as assessed via FT‐IR. G) Major proteins (collagen and fibronectin) in the FDM and FDM‐gel, respectively via western blot. H) Examination of physical stability of FDM‐gel and Col‐gel as stained by coomassie blue and then subsequently incubated at 37 °C for up to 14 days. I) Rheological property of FDM gel and Col‐gel. J) Identification of bioactive factors contained in the FDM‐gel via human angiogenic factors array. K) Proteomic analysis of FDM‐gel: structural and non‐structural proteins as assessed via mass spectrometer coupled with nano‐LC system. L) Gene ontology (GO) functional analysis: statistically significant top 10 biological processes. M) GO functional analysis: statistically significant top 10 molecular functions.
Figure 2
Figure 2
Subcutaneous transplantation of FDM‐gel and Col‐gel, respectively. Appearance of A) FDM‐gel and B) Col‐gel at 3 day post‐transplantation subcutaneously. C) Cross‐sectional view of C) FDM‐gel and D) Col‐gel at 3 day via H&E staining. Histological analysis of E) FDM‐gel and F) Col‐gel as assessed via Herovici staining (inset: co‐immunofluorescence via vimentin (green) and α‐SMA (red), along with DAPI staining) (*: the interface between FDM‐gel and host tissue). The dotted line (Insets) is the interface between host tissue and FDM‐gel or Col‐gel. G) Fibrous layer formation in the subcutaneous FDM‐gel and Col‐gel, respectively. Measurement of H) tumor necrosis factor (TNF)‐α and I) MPO activity in the FDM‐gel harvested at 1 and 3 day, respectively. J) Identification of the macrophages distributed inside/ around FDM‐gel and Col‐gel at 3 day, as assessed via immunofluorescence of CD45 and F4/80, along with DAPI staining. K) FACS analysis of the innate immune cells infiltrated inside the FDM‐gel, as determined by the antibody of leucocytes (CD45+) and macrophages (CD11b+/F4/80+). Statistically significant difference: *p<0.05.
Figure 3
Figure 3
Transplantation of FDM‐gels into excisional, full‐thickness skin wounds and comprehensive assessment of wound healing efficacy. A) Gross appearance of the wounds treated with Tegaderm dressing or FDM‐gel at 7 and 14 day. B) Quantitative measurement of the wound areas with time. C) Histological analysis of the wound regions (epidermis and dermis) via H&E staining (Yellow triangles in the FDM‐gel indicate new blood vessels). D) Collagen deposition and the degree of maturation in the regenerating wounds as assessed via Herovici staining. Immature and mature collagen appears in blue and purple/red, respectively. E) Co‐immunofluorescence staining of the wound area via vimentin and α‐SMA, along with DAPI staining. F) CD31 immunostaining for the endothelial cells at 7 day. G) Assessment of epidermal keratinocyte via K10 staining at 14 day. Quantitative analysis of wound healing parameters. H) Thickness of dermis (µm) at 7 day. I) The epidermal thickness (µm) at 14 day. J) Number of hair follicles per unit area at 14 day. K) Mature collagen area (%) at 14 day. L) Neovessel area (µm2) at 7 day. Statistically significant difference: **p<0.01 or ****p<0.0001.
Figure 4
Figure 4
Hair follicles formation and interaction between FDM and human dermal papilla cells in vitro. Co‐immunofluorescence (β‐catenin and α‐SMA) staining in the epidermal region at 14 day, where the wounds were treated with A) dressing or B) FDM‐gel. Co‐immunofluorescence (K10 and CD34) of the epidermal region, when treated with D) dressing or E) FDM‐gel. C,F) The normal skin tissue serves as a positive control. Co‐immunofluorescence (β‐catenin and α‐SMA) in the dermal region at 14 day, in which the wounds were administered with G) dressing or H) FDM‐gel. Co‐immunofluorescence (K14 and AE15) in the dermal region, when treated with J) dressing or K) FDM‐gel. I,L) The normal skin tissue was co‐stained as well. M) HDPCs were cultivated on either TCP or FDM and examined for the expression of α‐SMA and β‐catenin at 3 day. N) Quantitative measurement of β‐catenin (+) cells and their comparison between TCP and FDM substrate. O) HDPCs were treated with macrophage‐derived conditioned media (TCP‐Mac‐CM and FDM‐Mac‐CM), where macrophages were grown on TCP or FDM and assessed via western blot for Akt and phosphorylated Akt (p‐Akt). Serum‐free and growth media are negative control, whereas b‐FGF (700 pg mL−1) is a positive control. Quantitative comparison of P) Akt and Q) p‐Akt level. Statistically significant difference: *p<0.05, **p<0.01 or ****p<0.0001.
Figure 5
Figure 5
In‐depth analysis of the regenerated wound tissues harvested at specific time points. A) Appearance of FDM‐gel when transplanted into the full‐thickness wound at 0 and 3 day, post‐transplantation. B) Co‐immunofluorescence (FN and α‐SMA) of the FDM‐gel treated wounds at 7 day, along with DAPI staining (Part of FDM‐gel treated area was captured in the yellow box). C) Enlarged image of FDM‐gel treated region in the yellow box. Wound healing associated key proteins and markers were assessed using the regenerating wound tissues via western blot and the comparative data were quantitatively presented at 3, 7, and 14 day, respectively. A fibroblast and myofibroblast marker, D) vimentin and E) α‐SMA. F) Pro‐inflammatory cytokine, TNF‐α. An M2‐like macrophage marker, G) Arg‐1 and H) CD206. FCAS analysis of macrophages population in the wound tissues: I) CD11b+/F4/80+ cells (%) and J) CD206+ cells (%) out of total cells population, as assessed using dressing or FDM‐gel treated wound samples harvested at 7 and 10 day, respectively. K) Representative FACS dot plots for CD11b+/F4/80+ cells population in the FDM‐gel treated wounds collected at 3, 7, and 10 day, respectively. L) Percentage of CD11b+/F4/80+ cells out of total cells population as assessed using FDM‐gel treated wound tissues at 3, 7, and 10 day. M) Percentage of CD206+ cells among the CD11b+/F4/80+ cells population. Investigation of the major growth factors detected in the regenerated tissues with time: N) VEGF, O) bFGF, and P) TGF‐β1. Statistically significant difference: *p<0.05, ***p<0.001, or ****p<0.0001.
Figure 6
Figure 6
Interactions of macrophage‐FDM via cell surface integrins and their inhibition using specific antagonists. A) THP‐1 cells‐derived macrophages attached to either TCP or FDM. (Inset: An M2‐like macrophage marker, transglutaminase (TGM)−2 positively stained in green). Gene expression of M1‐like macrophage marker, B) iNOS and M2 marker, C) DC sign. Measurement of the growth factors contained in the conditioned media, where the macrophages were growing on two different substrates: D) TGF‐β1, E) VEGF, and F) bFGF. Quantitative analysis of growth factors released from different cell types (human dermal fibroblast‐hDFB and human mesenchymal stromal cell‐hMSC): G) VEGF and H) bFGF. I) An intracellular signaling molecule, p‐Akt as assessed by western blot. The MMP‐9 activity of macrophages in vitro when directly interacted with FDM or TCP at J) 1 day and K) 3 day, as evaluated via zymography. L) A schematic illustrates macrophage‐FDM interactions through cell surface integrins (α5β1, α1β1) and specific inhibitors (ATN 161 against α5β1, Obtustatin against α1β1) of such interaction. M) It shows the experimental timeline and the details regarding the macrophage‐ECM interaction and disruption of such interaction using specific integrins inhibitors. Inhibition of specific interaction of macrophage‐FDM and the effect on the secretion of N) VEGF and O) bFGF, as compared to that of non‐treated group (‐/‐). P) Quantitative analysis of p‐Akt as assessed via western blot. Measurement of the MMP‐9 activity in the macrophages, when they interacted with FDM (no treatment) or such interaction was inhibited by ATN 161 or Obtustatin at Q) 1 day and R) 3 day, as assessed via zymography. Statistically significant difference: *p<0.05, **p<0.01, ***p<0.001, or ****p<0.0001.
Figure 7
Figure 7
Assessment of inhibitory effect of macrophage‐FDM interaction via macrophage depletion model in vivo. Representative immunofluorescence images of A) F4/80+ cells and B) their quantitative comparison (n = 4, each group). C) Gross images of the wounds treated with FDM‐gel in depletion and non‐depletion model at 7 and 14 day, respectively. D) Quantification of the remaining wound area (%) with time. E) Representative images of H&E staining at 7 day. F) Measurement of the wound tissue thickness (µm). G) Histological examination of the wound regions (epidermis and dermis) via H&E staining (Yellow triangles indicate new blood vessels). H) Assessment of the neovessel area (µm2) at 7 day. Immunofluorescence of the growth factors, I) VEGF and J) bFGF at 7 day. Quantitative comparison of the growth factors, K) VEGF and L) bFGF as determined using the immunofluorescence images (n = 3, each group). M) Co‐immunofluorescence staining of the wound tissues by immune cell markers, CD11b, F4/80, and CD206, along with DAPI staining at 7 day. N) Co‐immunofluorescence of the wound area via vimentin and α‐SMA, along with DAPI staining at 7 and 14 day. O) Analysis of keratinocyte distribution in the epidermis region via K10 staining at 14 day. Statistically significant difference: *p<0.05, **p<0.01 or ****p<0.0001.

Similar articles

Cited by

References

    1. Pomahač B., Svensjö T., Yao F., Brown H., Eriksson E., Crit. Rev. Oral Biol. Med. 1998, 9, 333. - PubMed
    1. Tan J., Luo G., Severe Trauma and Sepsis, Springer, New York: 2019, 345.
    1. Eming S. A., Martin P., Tomic‐Canic M., Sci. Transl. Med. 2014, 6, 265sr6. - PMC - PubMed
    1. Rodero M. P., Khosrotehrani K., Int. J. Exp. Pathol. 2010, 3, 643. - PMC - PubMed
    1. Aurora A. B., Olson E. N., Cell Stem Cell 2014, 15, 14. - PMC - PubMed

LinkOut - more resources