

LRRC25 expression during physiological aging and in mouse models of Alzheimer's disease and iPSC-derived neurons
- PMID: 38476461
- PMCID: PMC10929014
- DOI: 10.3389/fnmol.2024.1365752
LRRC25 expression during physiological aging and in mouse models of Alzheimer's disease and iPSC-derived neurons
Abstract
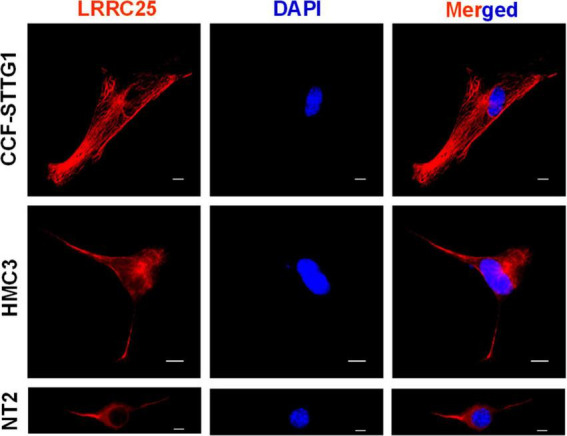
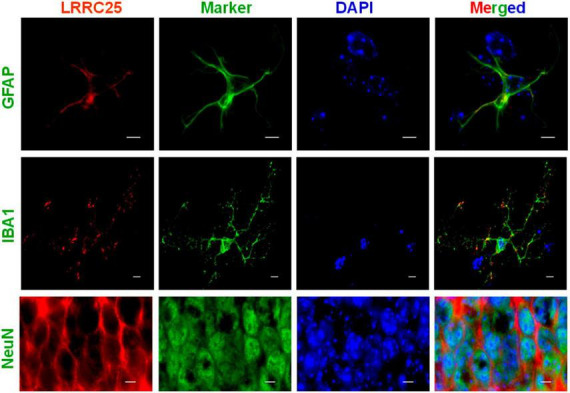
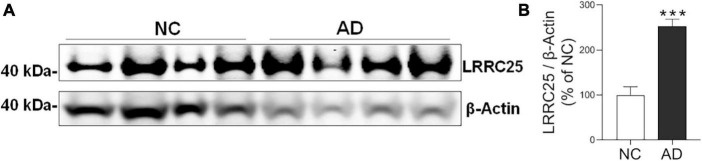
The leucine-rich repeat-containing protein 25 (LRRC25) is relatively a novel protein with no information on its role in neuronal or brain function. A recent study suggested LRRC25 is a potential risk factor for Alzheimer's disease (AD). As a first step to understanding LRRC25's role in the brain and AD, we found LRRC25 is expressed in both cell membranes and cytoplasm in a punctuate appearance in astrocytes, microglia, and neurons in cell lines as well as mouse brain. We also found that LRRC25 expression is both age- and brain region-dependent and that 1-day-old (1D) pups expressed the least amount of LRRC25 protein compared to adult ages. In the APΔE9 mice, immunoblot quantified LRRC25 protein levels were increased by 166% (**p < 0.01) in the cortex (CX) and by 215% (***p < 0.001) in the hippocampus (HP) relative to wild-type (WT) controls. Both the brainstem (BS) and cerebellum (CB) showed no significant alterations. In the 3xTg mice, only CX showed an increase of LRRC25 protein by 91% (*p < 0.05) when compared to WT controls although the increased trend was noted in the other brain regions. In the AD patient brains also LRRC25 protein levels were increased by 153% (***p < 0.001) when compared to normal control (NC) subjects. Finally, LRRC25 expression in the iPSC-derived neurons quantified by immunofluorescence was increased by 181% (**p < 0.01) in AD-derived neurons when compared to NC-derived neurons. Thus increased LRRC25 protein in multiple models of AD suggests that LRRC25 may play a pathogenic role in either Aβ or tau pathology in AD. The mechanism for the increased levels of LRRC25 in AD is unknown at present, but a previous study showed that LRRC25 levels also increase during neonatal hypoxic-ischemia neuronal damage. Based on the evidence that autophagy is highly dysregulated in AD, the increased LRRC25 levels may be due to decreased autophagic degradation of LRRC25. Increased LRRC25 in turn may regulate the stability or activity of key enzymes involved in either Aβ or hyperphosphorylated tau generation and thus may contribute to increased plaques and neurofibrillary tangles.
Keywords: 3xTg mice; APΔE9 mice; Alzheimer’s disease; LRRC25; aging; brain regions; iPSC neurons; immunohistochemistry.
Copyright © 2024 Devadoss, Akkaoui, Nair and Lakshmana.
Conflict of interest statement
The authors declare that the research was conducted in the absence of any commercial or financial relationships that could be construed as a potential conflict of interest.
Figures


Similar articles
-
Robust Increase in IQCK Protein Expression in Mouse Models of Alzheimer's Disease and iPSC-Derived Neurons.J Cell Mol Med. 2025 Jul;29(13):e70686. doi: 10.1111/jcmm.70686. J Cell Mol Med. 2025. PMID: 40604342 Free PMC article.
-
Novel Alzheimer risk factor IQ motif containing protein K is abundantly expressed in the brain and is markedly increased in patients with Alzheimer's disease.Front Cell Neurosci. 2022 Jul 19;16:954071. doi: 10.3389/fncel.2022.954071. eCollection 2022. Front Cell Neurosci. 2022. PMID: 35928571 Free PMC article.
-
Aberrant expression of the pore-forming KATP channel subunit Kir6.2 in hippocampal reactive astrocytes in the 3xTg-AD mouse model and human Alzheimer's disease.Neuroscience. 2016 Nov 12;336:81-101. doi: 10.1016/j.neuroscience.2016.08.034. Epub 2016 Aug 29. Neuroscience. 2016. PMID: 27586053
-
Therapeutic potentials of plant iridoids in Alzheimer's and Parkinson's diseases: A review.Eur J Med Chem. 2019 May 1;169:185-199. doi: 10.1016/j.ejmech.2019.03.009. Epub 2019 Mar 8. Eur J Med Chem. 2019. PMID: 30877973 Review.
-
Alzheimer's disease.Subcell Biochem. 2012;65:329-52. doi: 10.1007/978-94-007-5416-4_14. Subcell Biochem. 2012. PMID: 23225010 Review.
References
LinkOut - more resources
Full Text Sources
Molecular Biology Databases
Research Materials
Miscellaneous