

The impact of public transportation on the transmission of COVID-19 in Rwanda
- PMID: 38476489
- PMCID: PMC10927834
- DOI: 10.3389/fpubh.2024.1345433
The impact of public transportation on the transmission of COVID-19 in Rwanda
Abstract
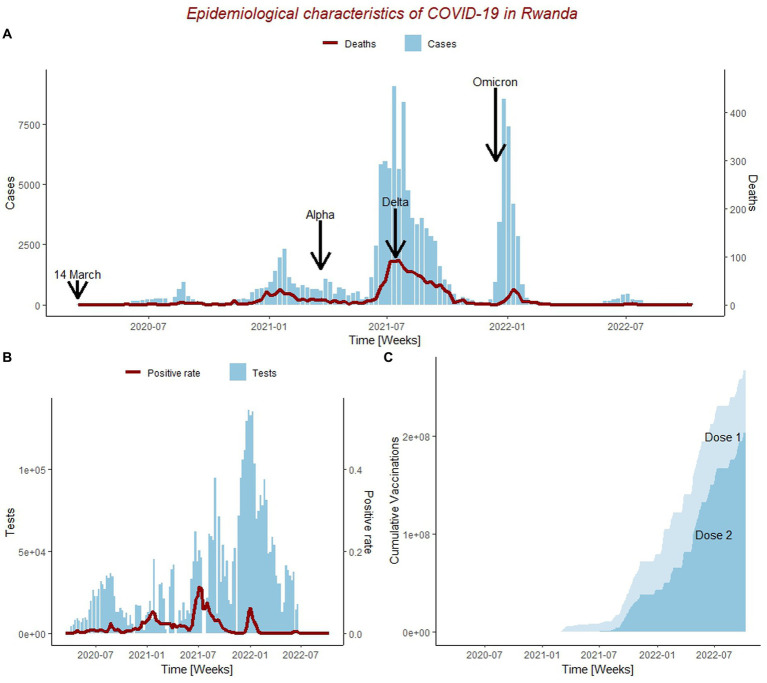
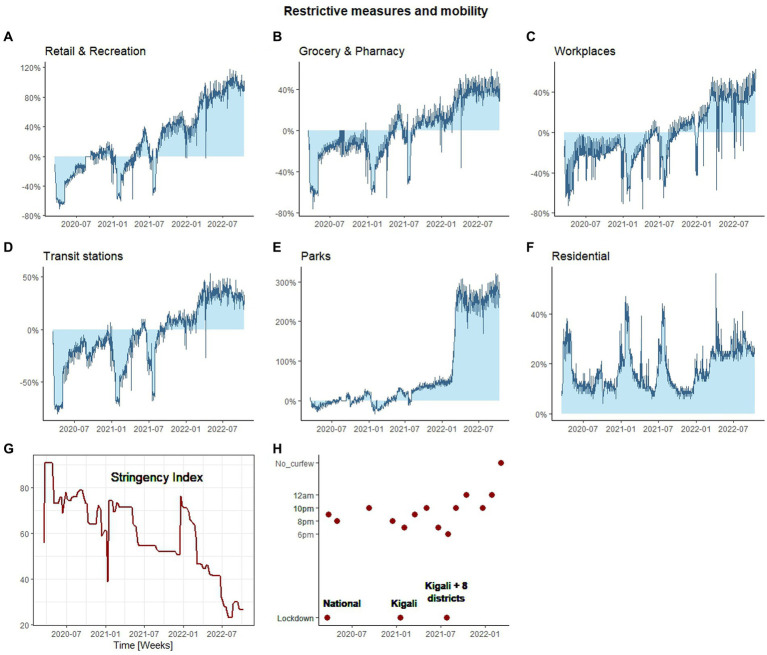
Introduction: The onset of the COVID-19 pandemic has placed a significant burden on healthcare systems worldwide, particularly in sub-Saharan regions where healthcare resources are limited. The transmission of SARS-CoV-2 is facilitated by the movement of people from place to place. Therefore, implementing measures that restrict movement of people and contacts is crucial in controlling the spread of the disease. Following the identification of the first COVID-19 case in Rwanda, the government implemented stringent measures, including a complete nationwide lockdown, border closures, curfews, reduced capacity in public transportation and businesses, and mandatory testing. This study aims to assess epidemiological trends in COVID-19 cases in relation to changes in population mobility within the public transportation system.
Methods: A descriptive analysis using publicly available data on COVID-19 epidemiological indicators (cases, deaths, vaccinations, and stringency index) and mobility data was conducted.
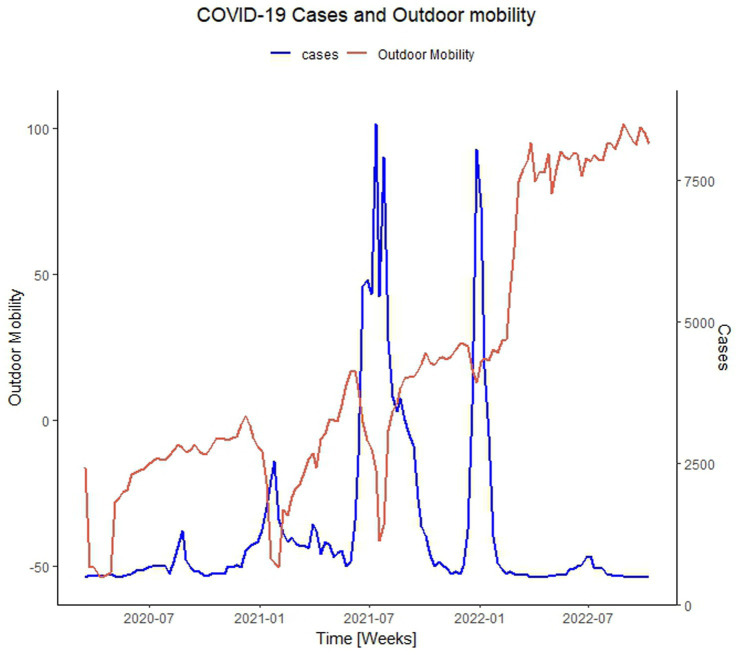
Results: The results reveal a strong correlation between mobility in public transportation and other activities, underscoring Rwanda's reliance on its public transportation system. The study also identifies a pattern where increases in transit station mobility preceded spikes in COVID-19 cases, suggesting that the subsequent rise in public transportation usage may contribute to higher infection rates.
Discussion: Therefore, this study emphasizes the importance of ongoing vigilance and regulatory measures regarding public transportation during infectious disease outbreaks.
Keywords: COVID-19; SARS-CoV-2; disease transmission; epidemiological trends; public transportation.
Copyright © 2024 Umutoni, Tumushime, Hewins, Udahemuka, Ndishimye, Kelvin and Sganzerla Martinez.
Conflict of interest statement
The authors declare that the research was conducted in the absence of any commercial or financial relationships that could be construed as a potential conflict of interest.
Figures
Similar articles
-
Public transit mobility as a leading indicator of COVID-19 transmission in 40 cities during the first wave of the pandemic.PeerJ. 2024 May 31;12:e17455. doi: 10.7717/peerj.17455. eCollection 2024. PeerJ. 2024. PMID: 38832041 Free PMC article.
-
Lessons Learned from Rwanda: Innovative Strategies for Prevention and Containment of COVID-19.Ann Glob Health. 2021 Feb 25;87(1):23. doi: 10.5334/aogh.3172. Ann Glob Health. 2021. PMID: 33665145 Free PMC article.
-
A SARS-CoV-2 Surveillance System in Sub-Saharan Africa: Modeling Study for Persistence and Transmission to Inform Policy.J Med Internet Res. 2020 Nov 19;22(11):e24248. doi: 10.2196/24248. J Med Internet Res. 2020. PMID: 33211026 Free PMC article.
-
One hundred thirty-three observed COVID-19 deaths in 10 months: unpacking lower than predicted mortality in Rwanda.BMJ Glob Health. 2021 Feb;6(2):e004547. doi: 10.1136/bmjgh-2020-004547. BMJ Glob Health. 2021. PMID: 33627363 Free PMC article. Review.
-
Travel-related control measures to contain the COVID-19 pandemic: a rapid review.Cochrane Database Syst Rev. 2020 Oct 5;10:CD013717. doi: 10.1002/14651858.CD013717. Cochrane Database Syst Rev. 2020. Update in: Cochrane Database Syst Rev. 2021 Mar 25;3:CD013717. doi: 10.1002/14651858.CD013717.pub2. PMID: 33502002 Updated.
References
-
- GDP growth (annual %) - Rwanda. (2022). Available at: https://data.worldbank.org/indicator/NY.GDP.MKTP.KD.ZG?locations=RW
-
- Bajpai J, Bower J. Ideas for growth a road map for e-mobility transition in Rwanda policy brief. (2001). Available at: www.theigc.org
-
- Cohn SK. The black death and the burning of Jews. Past Present. (2007) 196:3–36. doi: 10.1093/pastj/gtm005 - DOI
Publication types
MeSH terms
LinkOut - more resources
Full Text Sources
Medical
Miscellaneous