

Long access heroin self-administration significantly alters gut microbiome composition and structure
- PMID: 38476614
- PMCID: PMC10927763
- DOI: 10.3389/fpsyt.2024.1369783
Long access heroin self-administration significantly alters gut microbiome composition and structure
Abstract
Introduction: It is well known that chronic opioid use disorder is associated with alterations in gastrointestinal (GI) function that include constipation, reduced motility, and increased bacterial translocation due to compromised gut barrier function. These signs of disrupted GI function can be associated with alterations in the gut microbiome. However, it is not known if long-access opioid self-administration has effects on the gut microbiome.
Methods: We used 16S rRNA gene sequencing to investigate the gut microbiome in three independent cohorts (N=40 for each) of NIH heterogeneous stock rats before onset of long-access heroin self-administration (i.e., naïve status), at the end of a 15-day period of self-administration, and after post-extinction reinstatement. Measures of microbial α- and β-diversity were evaluated for all phases. High-dimensional class comparisons were carried out with MaAsLin2. PICRUSt2 was used for predicting functional pathways impacted by heroin based on marker gene sequences.
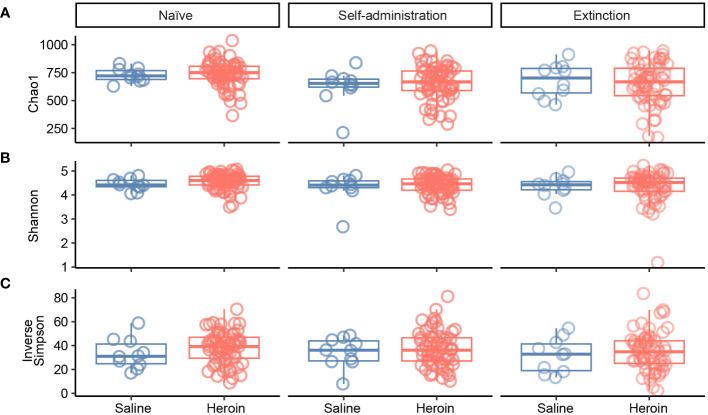
Results: Community α-diversity was not altered by heroin at any of the three phases by comparison to saline-yoked controls. Analyses of β-diversity showed that the heroin and saline-yoked groups clustered significantly apart from each other using the Bray-Curtis (community structure) index. Heroin caused significant alterations at the ASV level at the self-administration and extinction phases. At the phylum level, the relative abundance of Firmicutes was increased at the self-administration phase. Deferribacteres was decreased in heroin whereas Patescibacteria was increased in heroin at the extinction phase. Potential biomarkers for heroin emerged from the MaAsLin2 analysis. Bacterial metabolomic pathways relating to degradation of carboxylic acids, nucleotides, nucleosides, carbohydrates, and glycogen were increased by heroin while pathways relating to biosynthesis of vitamins, propionic acid, fatty acids, and lipids were decreased.
Discussion: These findings support the view that long access heroin self-administration significantly alters the structure of the gut microbiome by comparison to saline-yoked controls. Inferred metabolic pathway alterations suggest the development of a microbial imbalance favoring gut inflammation and energy expenditure. Potential microbial biomarkers and related functional pathways likely invoked by heroin self-administration could be targets for therapeutic intervention.
Keywords: acquisition; extinction; gut microbiome; heroin; microbial diversity; reinstatement.
Copyright © 2024 Greenberg, Winters, Zagorac, Kracht, Francescutti, Cannella, Ciccocioppo, Woods, Mackle, Hardiman, Kuhn, Kalivas, Kuhn and Angoa-Perez.
Conflict of interest statement
The authors declare that the research was conducted in the absence of any commercial or financial relationships that could be construed as a potential conflict of interest.
Figures


Similar articles
-
The Black Book of Psychotropic Dosing and Monitoring.Psychopharmacol Bull. 2024 Jul 8;54(3):8-59. Psychopharmacol Bull. 2024. PMID: 38993656 Free PMC article. Review.
-
Systemic pharmacological treatments for chronic plaque psoriasis: a network meta-analysis.Cochrane Database Syst Rev. 2021 Apr 19;4(4):CD011535. doi: 10.1002/14651858.CD011535.pub4. Cochrane Database Syst Rev. 2021. Update in: Cochrane Database Syst Rev. 2022 May 23;5:CD011535. doi: 10.1002/14651858.CD011535.pub5. PMID: 33871055 Free PMC article. Updated.
-
Incentives for preventing smoking in children and adolescents.Cochrane Database Syst Rev. 2017 Jun 6;6(6):CD008645. doi: 10.1002/14651858.CD008645.pub3. Cochrane Database Syst Rev. 2017. PMID: 28585288 Free PMC article.
-
Sertindole for schizophrenia.Cochrane Database Syst Rev. 2005 Jul 20;2005(3):CD001715. doi: 10.1002/14651858.CD001715.pub2. Cochrane Database Syst Rev. 2005. PMID: 16034864 Free PMC article.
-
Management of urinary stones by experts in stone disease (ESD 2025).Arch Ital Urol Androl. 2025 Jun 30;97(2):14085. doi: 10.4081/aiua.2025.14085. Epub 2025 Jun 30. Arch Ital Urol Androl. 2025. PMID: 40583613 Review.
Cited by
-
Understanding the impact of the gut microbiome on opioid use disorder: Pathways, mechanisms, and treatment insights.Microb Biotechnol. 2024 Oct;17(10):e70030. doi: 10.1111/1751-7915.70030. Microb Biotechnol. 2024. PMID: 39388360 Free PMC article. Review.
-
The Gut-Brain Axis in Opioid Use Disorder: Exploring the Bidirectional Influence of Opioids and the Gut Microbiome-A Comprehensive Review.Life (Basel). 2024 Sep 25;14(10):1227. doi: 10.3390/life14101227. Life (Basel). 2024. PMID: 39459527 Free PMC article. Review.
-
Sex differences in opioid response: a role for the gut microbiome?Front Pharmacol. 2024 Aug 29;15:1455416. doi: 10.3389/fphar.2024.1455416. eCollection 2024. Front Pharmacol. 2024. PMID: 39268474 Free PMC article. Review.
-
Longitudinal and Concurrent Changes in Brain and Gut due to Morphine Self-Administration.Addict Biol. 2025 Jun;30(6):e70059. doi: 10.1111/adb.70059. Addict Biol. 2025. PMID: 40495357 Free PMC article.
-
Immune Signatures in Post-Acute Sequelae of COVID-19 (PASC) and Myalgia/Chronic Fatigue Syndrome (ME/CFS): Insights from the Fecal Microbiome and Serum Cytokine Profiles.Biomolecules. 2025 Jun 25;15(7):928. doi: 10.3390/biom15070928. Biomolecules. 2025. PMID: 40723800 Free PMC article.
References
-
- Quality CfBHSa . 2017 National Survey on Drug Use and Health: Detailed Tables. Rockville, MD: Substance Abuse and Mental Health Services Administration; (2018).
-
- National vital Statistics System, Mortality. Cdc Wonder; (2019). Available at: https://wonder.cdc.gov/.
Grants and funding
LinkOut - more resources
Full Text Sources