. 2024 Mar 11;14(3):e11124.
doi: 10.1002/ece3.11124. eCollection 2024 Mar.

Scorpionfish adjust skin pattern contrast on different backgrounds

Affiliations

Scorpionfish adjust skin pattern contrast on different backgrounds

Leonie John et al. Ecol Evol. .

Abstract

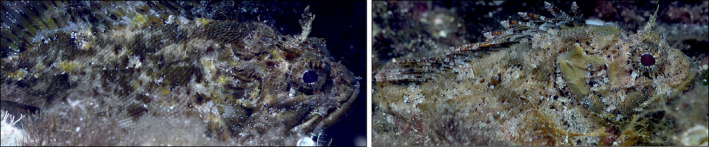
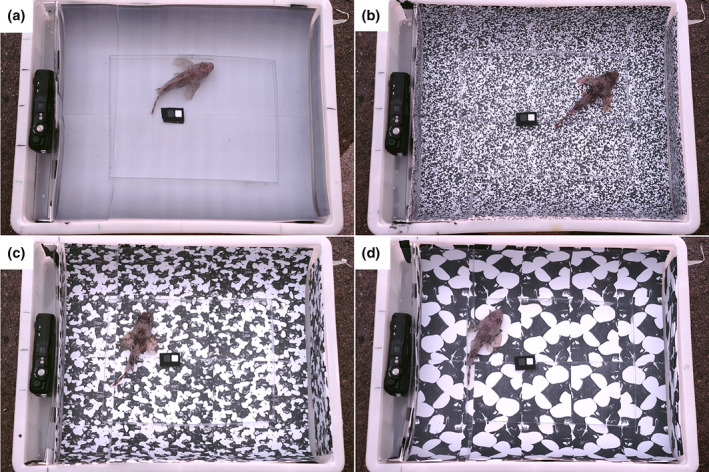
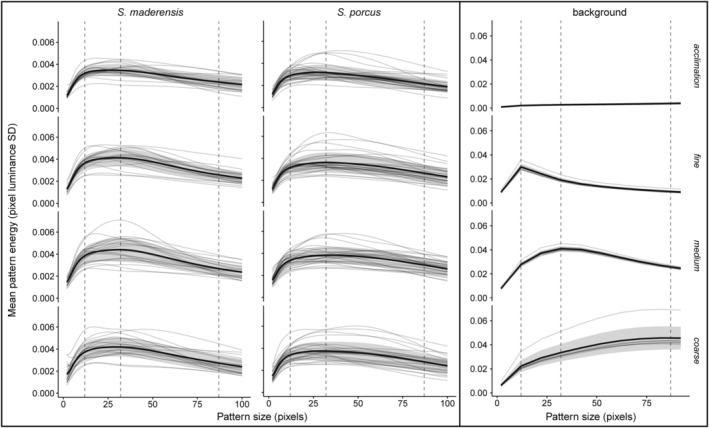
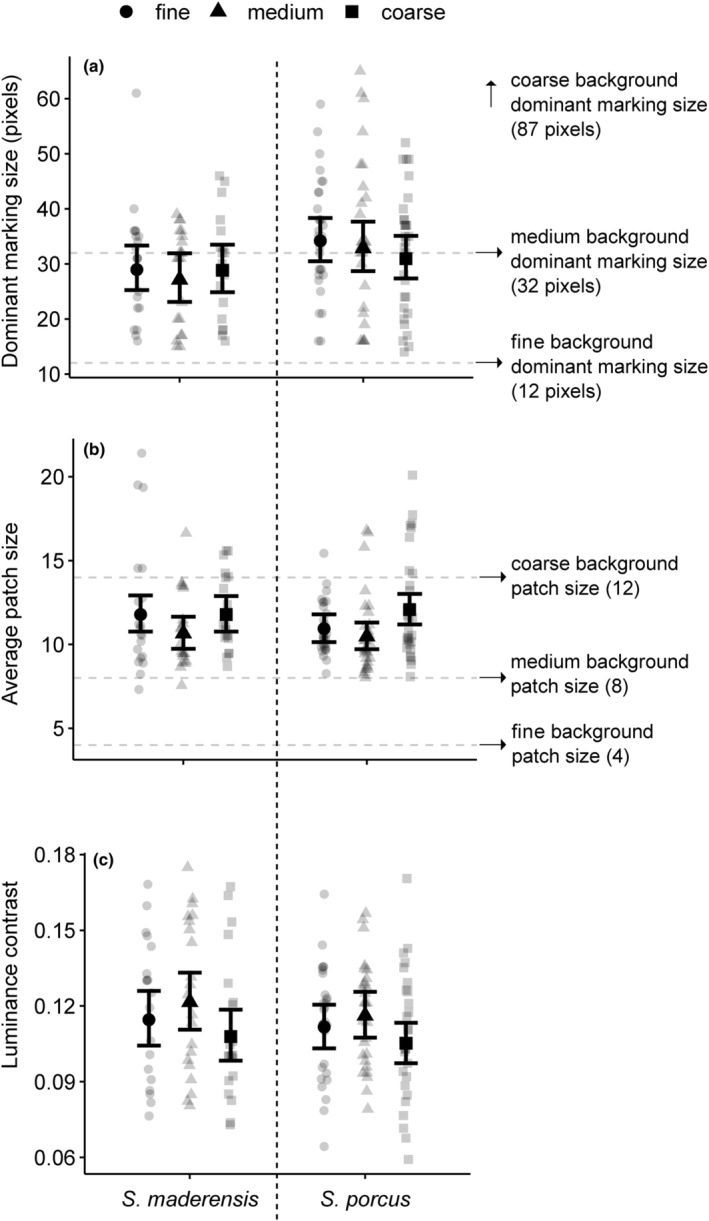
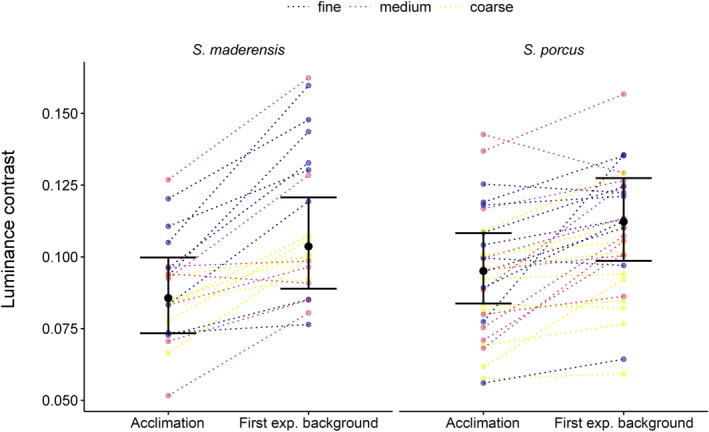
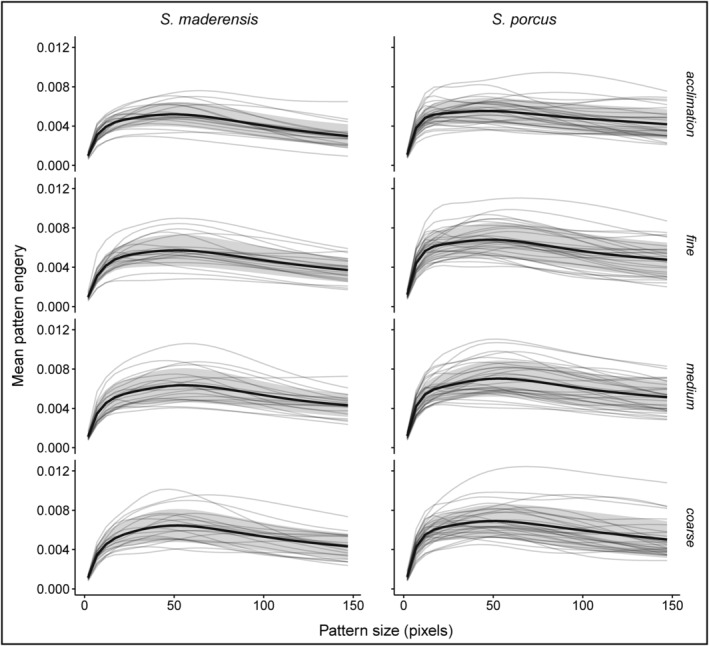
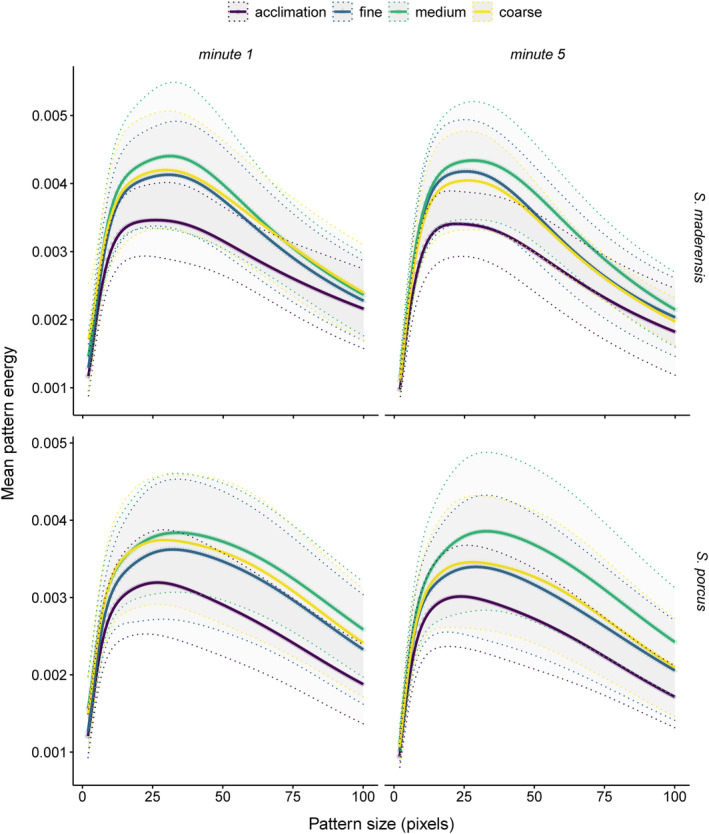
The two scorpionfish species Scorpaena maderensis and S. porcus are well camouflaged ambush predators that rapidly change body colouration to adjust to background colour in less than 1 min. We tested whether individuals of both species also adjust body pattern to that of the background. We placed fish on backgrounds of different pattern granularity and quantified the change in fish body pattern over 1 min. We used calibrated image analysis to analyse the patterns from the visual perspective of a prey fish species using a granularity (pattern energy) analysis and an image clustering approach. In our experiment, fish did not change their most contrasting pattern components as defined by the dominant marking size, but changed their average marking size. Moreover, fish responded with a change in pattern in contrast to the different experimental backgrounds, especially when compared to the acclimation phase. These results indicate that scorpionfish have one main pattern that can be adjusted by modulating its internal contrast. A reduction in pattern contrast could thereby improve background matching, while an increase could promote camouflage via disruptive colouration.

Keywords: QCPA; background matching; camouflage; colour change; disruptive colouration; pattern energy analysis.


Conflict of interest statement

The authors declare that they have no competing interests.

Figures

FIGURE 1
FIGURE 1
Two Scorpaena porcus individuals with different skin patterns. Photos by MS.
FIGURE 2
FIGURE 2
Exemplary top view photos in the experimental setup with the same Scorpaena porcus individual on (a) the acclimation background and the three experimental backgrounds with (b) fine, (c) medium and (d) coarse granularity. Body area of this individual was 6.5 cm2. The left side of each tray has a small compartment with a camera for side view photos. Fish are kept in the centre of the tray with a transparent plastic frame (best visible in a).
FIGURE 3
FIGURE 3
Pattern energy spectra (pattern energy for each pattern size bin) of the acclimation (uniform) and the three experimental backgrounds (right block), and of fish pattern for Scorpaena maderensis and S. porcus on each background (left block). Dashed vertical lines indicate the dominant marking size of the experimental background pattern (fine: x = 12, medium: x = 32, coarse: x = 87). The grey lines are spectra for each individual. The black lines indicate mean pattern energy over all individuals with standard deviation as the grey shaded area. Note the difference in pattern energy (range of y‐axis) between fish and backgrounds. Pattern energy is defined as the standard deviation of the luminance channel's cone catches of the filtered pixels (see Section 2).
FIGURE 4
FIGURE 4
Fish pattern metrics depending on background granularity. (a) Dominant marking size is the spatial scale (measured in pixels) showing the highest contrast per individual fish, based on the granularity analysis. Dashed horizontal lines indicate the dominant marking size of the experimental backgrounds (fine: y = 12, medium: y = 32, coarse: y = 87). (b) Average patch size is the average size of clusters derived from the RNL clustered image of the fish body in the CAA. Dashed horizontal lines indicate the average patch size of the experimental background pattern (fine: y = 4, medium: y = 8, coarse: y = 14). (c) Luminance contrast is given as the mean contrast value of edges based on the LEIA. Points represent observations for each individual fish (N = 21 Scorpaena maderensis, N = 30 S. porcus). Markers with vertical bars represent predicted medians and 95% compatibility intervals (CIs) derived from 10,000 simulations of the posterior distribution of model parameters. The strength of the difference between two groups increases with decreasing degree of overlap of their 95% CIs.
FIGURE 5
FIGURE 5
Fish change their pattern contrast between acclimation and the first experimental background. Contrast is given as the mean contrast value of edges based on the LEIA. The horizontal lines connect data points of an individual, colours indicate the background type used in the first experimental background. Points represent observations for each individual fish (N = 21 Scorpaena maderensis, N = 30 S. porcus). Markers with vertical bars represent predicted medians and 95% compatibility intervals (CIs) derived from 10,000 simulations of the posterior distribution of model parameters. The strength of the difference between two groups increases with decreasing degree of overlap of their 95% CIs.
FIGURE A1
FIGURE A1
Pattern energy spectra (pattern energy for each pattern size bin) of Scorpaena maderensis (n = 20) and S. porcus (n = 30) on the acclimation (uniform) and the three experimental backgrounds based on the side view photos. The grey lines are spectra for each individual. The black lines indicate mean pattern energy over all individuals with standard deviation as the grey shaded area. Pattern energy is defined as the standard deviation of the luminance channel's cone catches of the filtered pixels (see Section 2).
FIGURE A2
FIGURE A2
Pattern energy spectra (pattern energy for each pattern size bin) of Scorpaena maderensis (n = 21) and S. porcus (n = 30) on the acclimation (uniform) and the three experimental backgrounds, split by the timepoint at which the measurement was taken (after 1 or 5 min). The thick lines indicate mean pattern energy, the dotted lines indicate its standard deviation. Pattern energy is defined as the standard deviation of the luminance channel's cone catches of the filtered pixels (see Section 2).

References

    1. Akkaynak, D. , Siemann, L. A. , Barbosa, A. , & Mäthger, L. M. (2017). Changeable camouflage: How well can flounder resemble the colour and spatial scale of substrates in their natural habitats? Royal Society Open Science, 4, 160824. - PMC - PubMed
    1. Allen, J. J. , Akkaynak, D. , Sugden, A. U. , & Hanlon, R. T. (2015). Adaptive body patterning, three‐dimensional skin morphology and camouflage measures of the slender filefish Monacanthus tuckeri on a Caribbean coral reef. Biological Journal of the Linnean Society, 116, 377–396. - PMC - PubMed
    1. Barbosa, A. , Mäthger, L. M. , Buresch, K. C. , Kelly, J. , Chubb, C. , Chiao, C. C. , & Hanlon, R. T. (2008). Cuttlefish camouflage: The effects of substrate contrast and size in evoking uniform, mottle or disruptive body patterns. Vision Research, 48, 1242–1253. - PubMed
    1. Bitton, P. P. , Harant, U. K. , Fritsch, R. , Champ, C. M. , Temple, S. E. , & Michiels, N. K. (2017). Red fluorescence of the triplefin Tripterygion delaisi is increasingly visible against background light with increasing depth. Royal Society Open Science, 4, 161009. - PMC - PubMed
    1. Bond, A. B. , & Kamil, A. C. (2002). Visual predators select for crypticity and polymorphism in virtual prey. Nature, 415, 609–613. - PubMed

LinkOut - more resources