. 2024 Feb 19;27(4):146.
doi: 10.3892/etm.2024.12434. eCollection 2024 Apr.

Novel underlying genetic markers for asthenozoospermia due to abnormal spermatogenesis and reproductive organ inflammation

Affiliations

Novel underlying genetic markers for asthenozoospermia due to abnormal spermatogenesis and reproductive organ inflammation

Yaodong Zhang et al. Exp Ther Med. .

Abstract

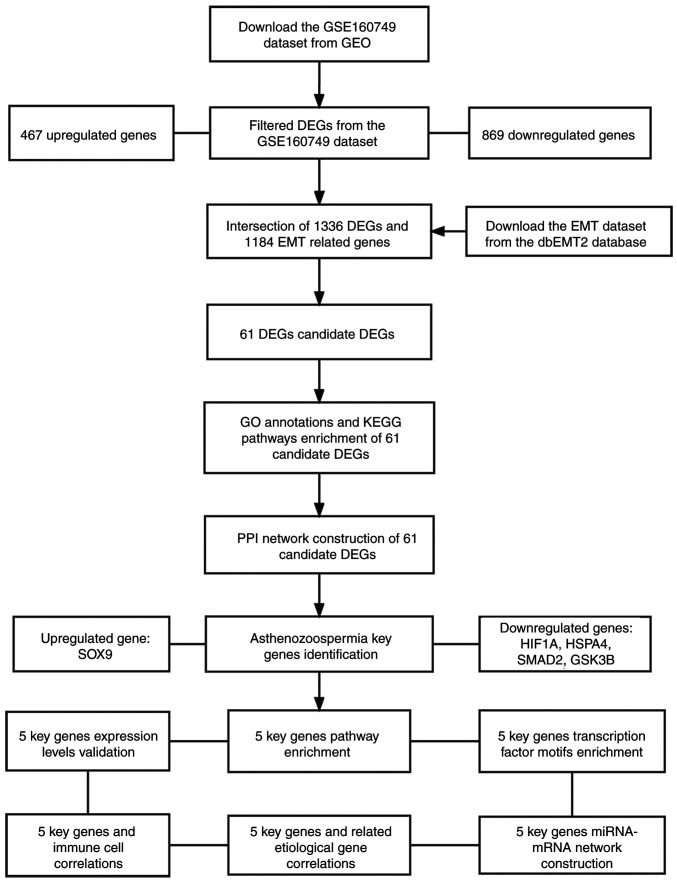
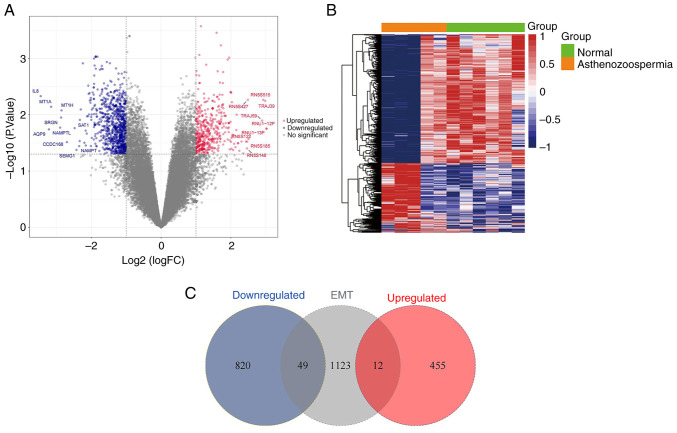
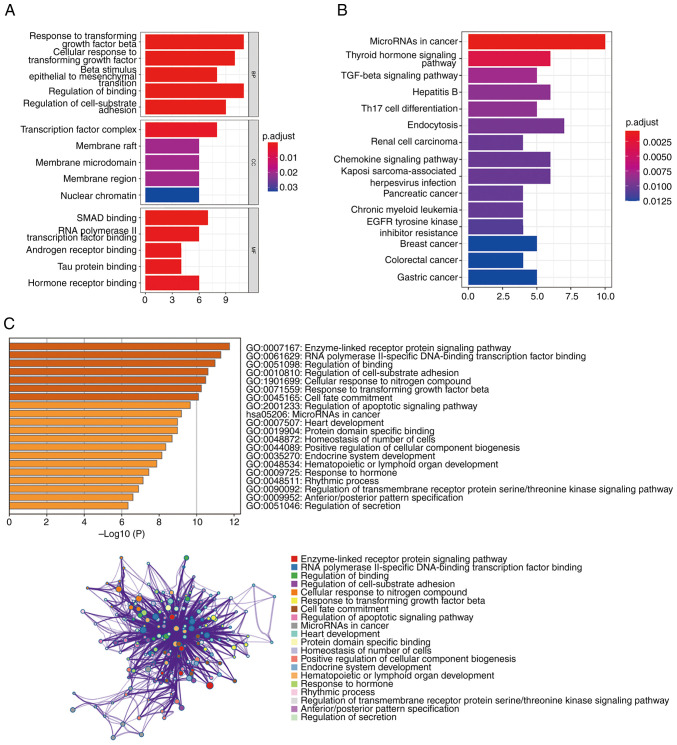
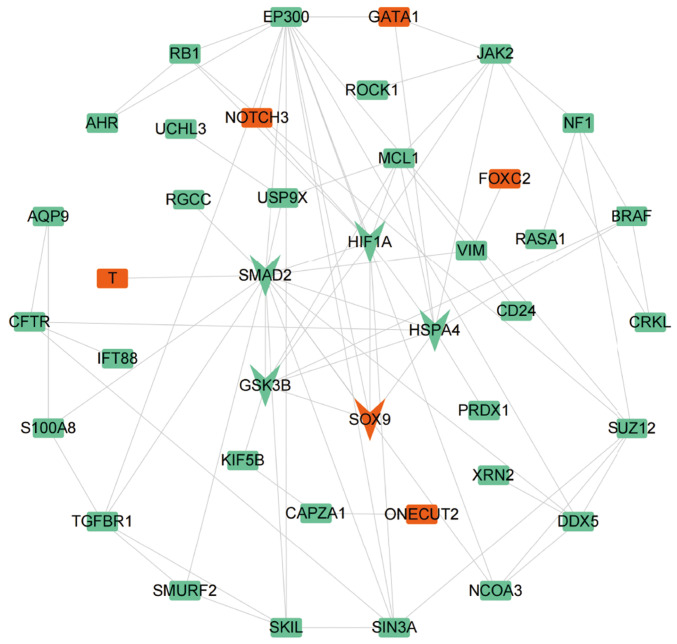
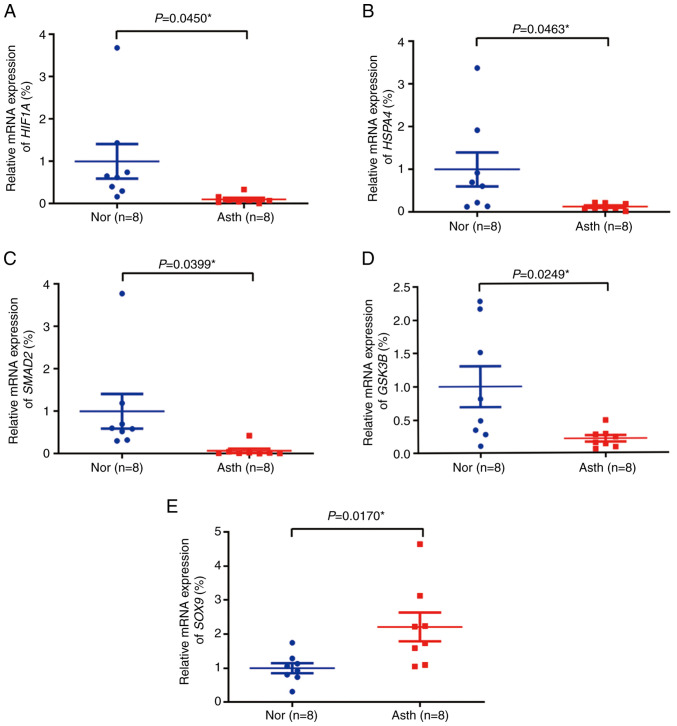
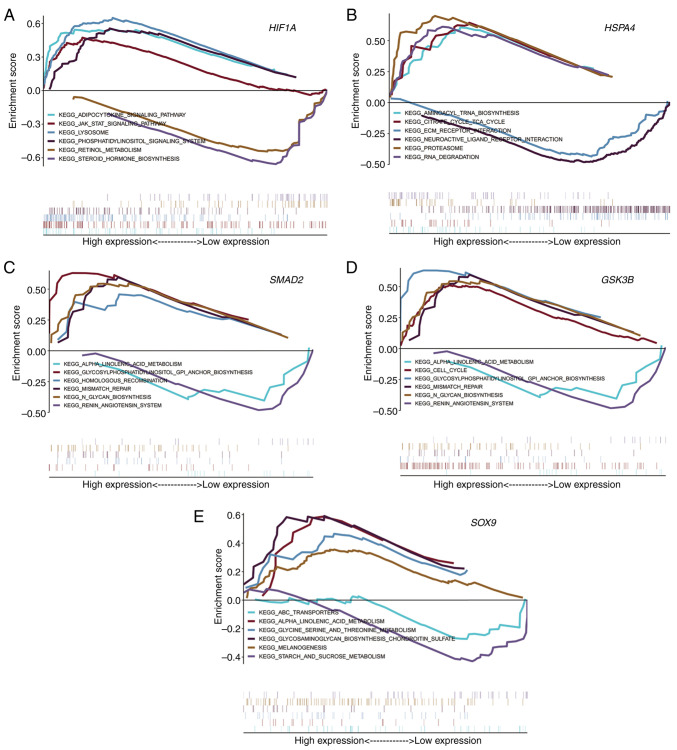
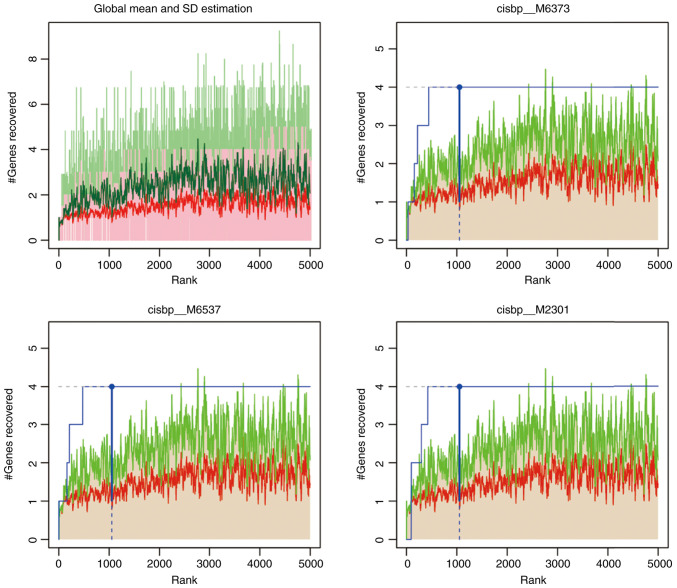
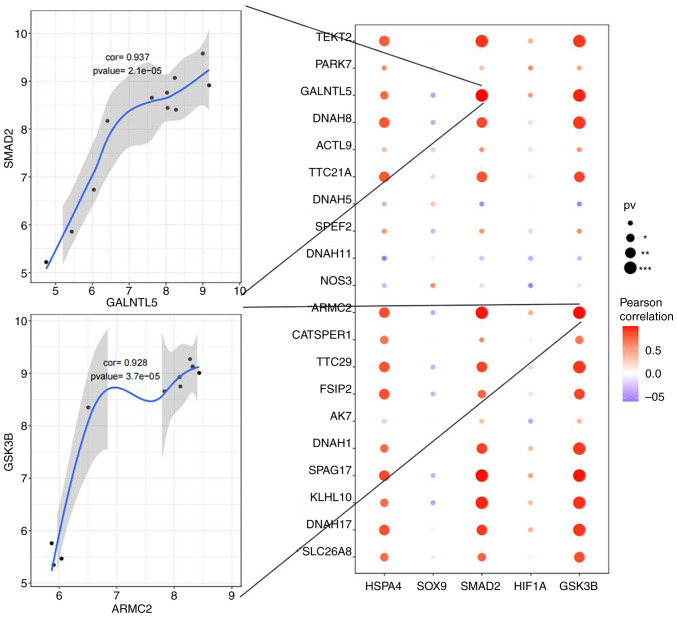
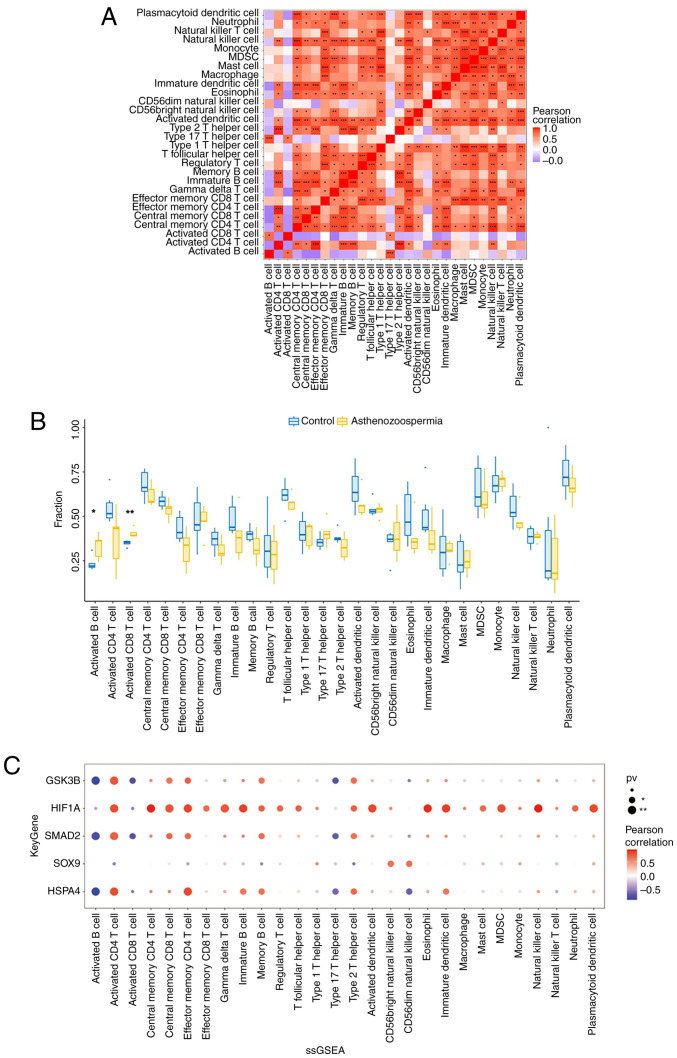
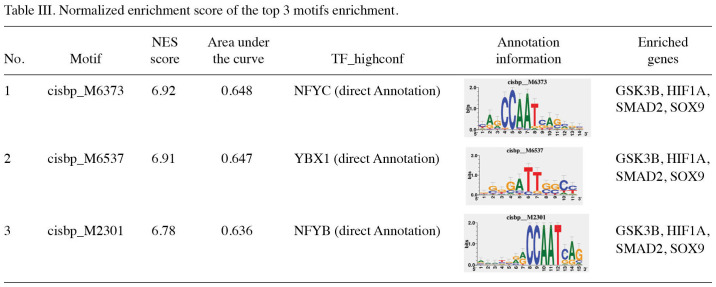
Asthenozoospermia, a male fertility disorder, has a complex and multifactorial etiology. Moreover, the effectiveness of different treatments for asthenozoospermia remains uncertain. Hence, by using bioinformatics techniques, the present study aimed to determine the underlying genetic markers and pathogenetic mechanisms associated with asthenozoospermia due to abnormal spermatogenesis and inflammation of the reproductive tract. GSE160749 dataset was downloaded from the Gene Expression Omnibus database, and the data were filtered to obtain 1336 differentially expressed genes (DEGs) associated with asthenozoospermia. These DEGs were intersected with the epithelial mesenchymal transition datasets to yield 61 candidate DEGs. Gene Ontology and Kyoto Encyclopedia of Genes and Genomes pathway enrichment analyses were performed, and the results revealed that these candidate DEGs were significantly enriched in the enzyme-linked receptor pathway and the thyroid hormone pathway. A protein-protein interaction network was constructed to identify the key genes of asthenozoospermia. A total of five key genes were identified, among which SOX9 was significantly upregulated, while HSPA4, SMAD2, HIF1A and GSK3B were significantly downregulated. These findings were validated by conducting reverse transcription-quantitative PCR for clinical semen samples. To determine the underlying molecular mechanisms, a regulatory network of transcription factors and miRNA-mRNA interactions was predicted. The expression levels of HSPA4, SMAD2 and GSK3B were positively associated with several related etiological genes of asthenozoospermia. In total, five key genes were closely associated with the level and type of immune cells; higher levels of activated B cells and CD8 T cells were observed in asthenozoospermia. Thus, the findings of the present study may provide clues to determine the underlying novel diagnostic genetic markers and treatment strategies for asthenozoospermia.

Keywords: asthenozoospermia; bioinformatics techniques; genetic markers; immune cells; reproductive organ inflammation; spermatogenesis.


Conflict of interest statement

The authors declare that they have no competing interests.

Figures

Figure 1
Figure 1
Flowchart of study design and data processing. GEO, Gene Expression Omnibus; DEGs, differentially expressed genes; EMT, epithelial-mesenchymal transition; GO, Gene Ontology; KEGG, Kyoto Encyclopedia of Genes and Genomes; PPI, protein-protein interaction; miRNA, microRNA.
Figure 2
Figure 2
Filtered DEGs from the GSE160749 and EMT datasets. (A) Volcano plot of 1,336 DEGs in six fertile control samples and five asthenozoospermia samples of the GSE160749 dataset. The red points represent upregulated DEGs, the blue points represent downregulated DEGs, and the gray points represent no significant DEGs. X-axis represents fold change, and the farther point from the center with the greater significant difference; Y-axis represents -log10 (P-value) results, and the closer point to the top with the greater significant difference. (B) Heatmap of 1,336 DEGs in six fertile control samples and five asthenozoospermia samples of the GSE160749 dataset. The X-axis represents the samples and the Y-axis represents the genes. The red and blue rectangles respectively represent upregulated and downregulated genes. The deeper red colors indicate the higher expression of genes, the deeper blue colors indicate the lower expression of genes. The black connecting lines indicate the clustering relation among the genes. (C) Venn analysis of the upregulated (red) and downregulated (blue) DEGs intersected with the EMT datasets (gray). DEGs, differentially expressed genes; EMT, epithelial-mesenchymal transition.
Figure 3
Figure 3
Enrichment analysis of the 61 candidates DEGs. (A) GO annotations of the 61 candidate DEGs. The X-axis represents the count of enrichment genes. (B) KEGG pathway enrichment analysis of the 61 candidate DEGs. The X-axis represents the count of enrichment genes. (C) Metascape database pathway enrichment analysis of the 61 candidate DEGs. The X-axis represents -log10 (P-value) results; the greater result indicates that the pathway is more significant. DEGs, differentially expressed genes; GO, Gene Ontology; KEGG, Kyoto Encyclopedia of Genes and Genomes; BP, biological process; CC, cellular component; MF, molecular function.
Figure 4
Figure 4
Construction of a PPI network for the differentially expressed genes of 61 candidates. There are 40 nodes and 80 edges in the PPI network. Each node represents a protein, the orange and green colors respectively indicate upregulated and downregulated genes. Each edge represents a link with two proteins, indicating the functional association between proteins. HIF1A, HSPA4, SOX9, GSK3B, and SMAD2 is the highest score cluster (score=5.00) which include five nodes and 10 edges. PPI, protein-protein interaction.
Figure 5
Figure 5
Reverse transcription-quantitative PCR validation of the expression of the five key genes in the clinical semen samples. The unpaired t-test was used to compare the expression of the five key genes between Nor and Asth. (A) HIF1A. (B) HSPA4. (C) SMAD2. (D) GSK3B. (E) SOX9. Nor, normal group; Asth, asthenozoospermia group.
Figure 6
Figure 6
Pathway enrichment analysis of the five key genes. Each key gene display six representative KEGG enrichment pathways. The curve above the X-axis indicates that the gene set of the KEGG pathway, where the key gene is located, is highly expressed in the asthenozoospermia group and vice versa, indicating low expression. (A) HIF1A. (B) HSPA4. (C) SMAD2. (D) GSK3B. (E) SOX9. KEGG, Kyoto Encyclopedia of Genes and Genomes.
Figure 7
Figure 7
Normalized enrichment score of the top 3 motifs from the cumulative recovery curve. Red line, the global mean of the recovered curve of motif. Green line, mean ± standard deviation. Blue line, the recovered curve of the current motif. Motif is statistically significant when the recovered curve is greater than the mean ± standard deviation.
Figure 8
Figure 8
Correlation analysis of the five key genes and the top 20 asthenozoospermia-related etiological genes using Pearson's method. *P<0.05, **P<0.01 and ***P<0.001. Cor, correlation.
Figure 9
Figure 9
Correlation analysis of the five key genes and immune cells. (A) Correlations of multiple immune cells in the 11 semen samples from the GSE160749 dataset analyzed using Pearson's method. (B) Comparison of the levels of immune cells in the 11 semen samples from the GSE160749 dataset using the Wilcoxon rank-sum test. (C) Correlations of the expression levels of the five key genes and multiple immune cells in the 11 semen samples from the GSE160749 dataset analyzed using Pearson's method. *P<0.05, **P<0.01 and ***P<0.001. ssGSEA, single-sample gene set enrichment analysis.
Table III
Table III

Similar articles

References

    1. Agarwal A, Baskaran S, Parekh N, Cho CL, Henkel R, Vij S, Arafa M, Panner Selvam MK, Shah R. Male infertility. Lancet. 2021;397:319–333. doi: 10.1016/S0140-6736(20)32667-2. - DOI - PubMed
    1. WHO-World Health Organization. WHO Laboratory Manual for the Examination and Processing of Human Semen (6th ed). In: Examination and post-examination procedures. WHO. 2021. https://apps.who.int/iris/rest/bitstreams/1358672/retrieve. Accessed 27 Jul, 2021.
    1. Mehra BL, Skandhan KP, Prasad BS, Pawankumar G, Singh G, Jaya V. Male infertility rate: A retrospective study. Urologia. 2018;85:22–24. doi: 10.5301/uj.5000254. - DOI - PubMed
    1. Guzick DS, Overstreet JW, Factor-Litvak P, Brazil CK, Nakajima ST, Coutifaris C, Carson SA, Cisneros P, Steinkampf MP, Hill JA, et al. Sperm morphology, motility, and concentration in fertile and infertile men. N Engl J Med. 2001;345:1388–1393. doi: 10.1056/NEJMoa003005. - DOI - PubMed
    1. Cho CL, Esteves SC, Agarwal A. Novel insights into the pathophysiology of varicocele and its association with reactive oxygen species and sperm DNA fragmentation. Asian J Androl. 2016;18:186–193. doi: 10.4103/1008-682X.170441. - DOI - PMC - PubMed