. 2024 Feb 27:15:1347422.
doi: 10.3389/fmicb.2024.1347422. eCollection 2024.

The archaeome in metaorganism research, with a focus on marine models and their bacteria-archaea interactions

Affiliations

The archaeome in metaorganism research, with a focus on marine models and their bacteria-archaea interactions

Avril J E von Hoyningen-Huene et al. Front Microbiol. .

Abstract

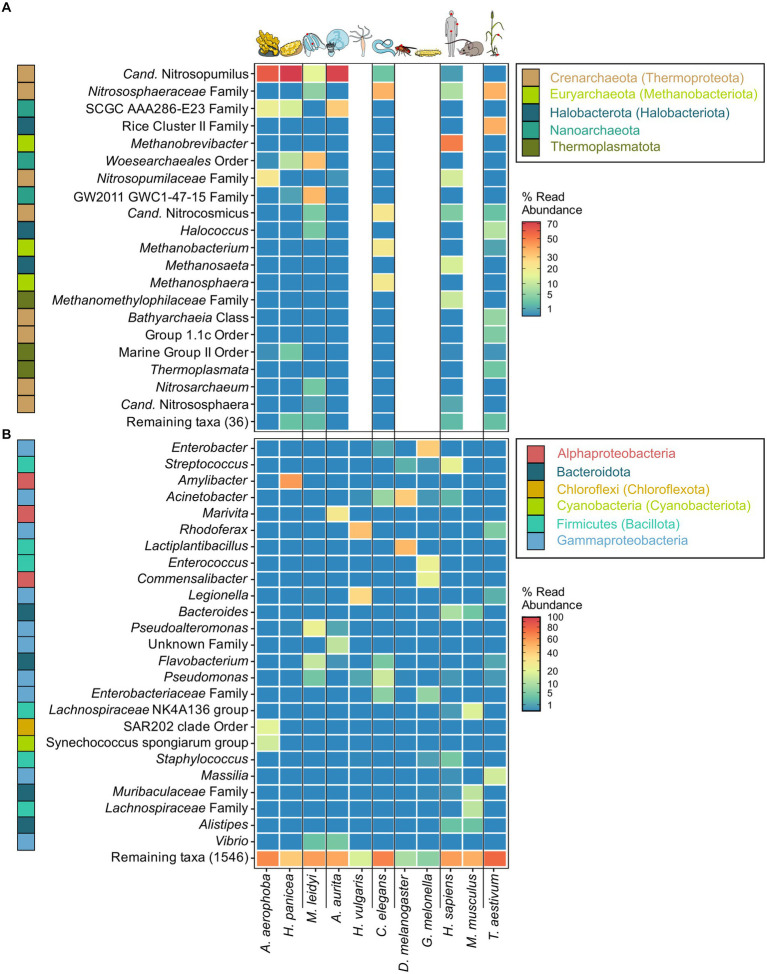
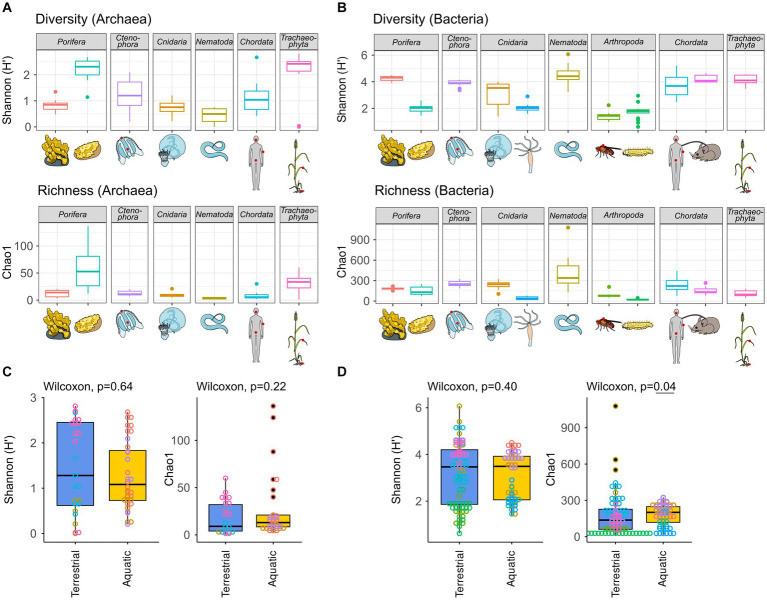
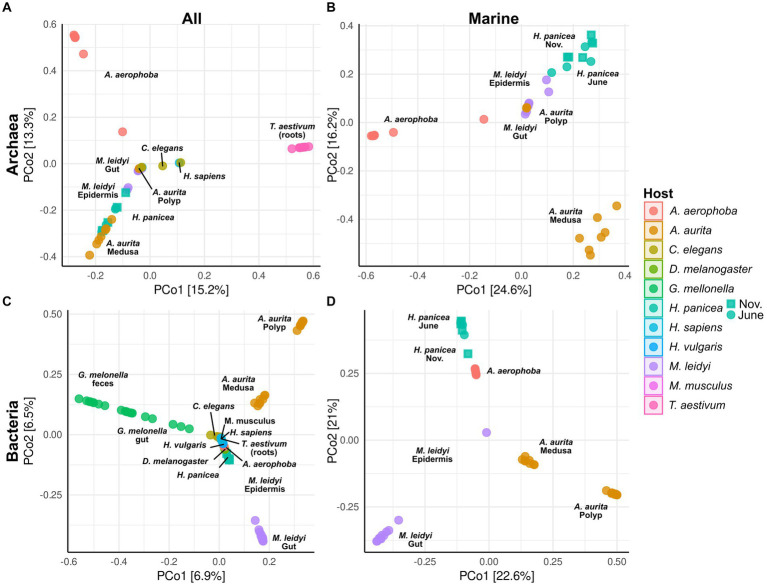
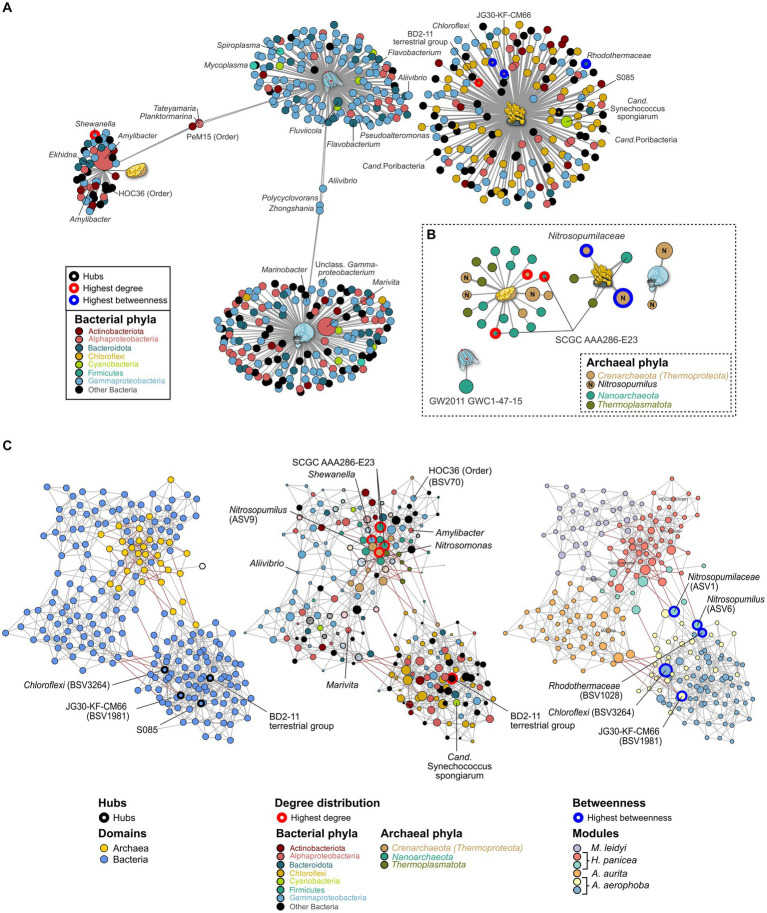
Metaorganism research contributes substantially to our understanding of the interaction between microbes and their hosts, as well as their co-evolution. Most research is currently focused on the bacterial community, while archaea often remain at the sidelines of metaorganism-related research. Here, we describe the archaeome of a total of eleven classical and emerging multicellular model organisms across the phylogenetic tree of life. To determine the microbial community composition of each host, we utilized a combination of archaea and bacteria-specific 16S rRNA gene amplicons. Members of the two prokaryotic domains were described regarding their community composition, diversity, and richness in each multicellular host. Moreover, association with specific hosts and possible interaction partners between the bacterial and archaeal communities were determined for the marine models. Our data show that the archaeome in marine hosts predominantly consists of Nitrosopumilaceae and Nanoarchaeota, which represent keystone taxa among the porifera. The presence of an archaeome in the terrestrial hosts varies substantially. With respect to abundant archaeal taxa, they harbor a higher proportion of methanoarchaea over the aquatic environment. We find that the archaeal community is much less diverse than its bacterial counterpart. Archaeal amplicon sequence variants are usually host-specific, suggesting adaptation through co-evolution with the host. While bacterial richness was higher in the aquatic than the terrestrial hosts, a significant difference in diversity and richness between these groups could not be observed in the archaeal dataset. Our data show a large proportion of unclassifiable archaeal taxa, highlighting the need for improved cultivation efforts and expanded databases.

Keywords: archaeome; host-associated microbiota; marine archaea; metaorganism; microbial community; microbiome.


Conflict of interest statement

The authors declare that the research was conducted in the absence of any commercial or financial relationships that could be construed as a potential conflict of interest.

Figures

Figure 1
Figure 1
Most abundant archaeal (A) and bacterial (B) genera across the tested host organisms. The heatmaps are based on relative abundances where taxa with an abundance <0.01 are plotted in the same shade of blue. The best possible taxonomic assignment was used to label each group. Phylum affiliations of each genus are indicated through colored blocks to the left of the genus names. Phyla include names according to the GTDB taxonomy where divergent from the SILVA taxonomy. Proteobacteria (Pseudomonadota) are plotted as Alpha- and Gammaproteobacteria on the class level.
Figure 2
Figure 2
Archaeal (A) and bacterial (B) diversity and richness indices, as well as group comparisons between aquatic and terrestrial hosts (C,D). Diversity (Shannon H′) and richness (Chao1) indices were calculated based on all samples rarefied to 10,000 reads. Hosts were grouped as terrestrial [H. sapiens, M. musculus, C. elegans, D. melanogaster, G. melonella, and T. aestivum] or aquatic [A. aerophoba, H. panicea, A. aurita, M. leidyi, and Hydra vulgaris]. Differences in diversity and richness means between the groups were tested using a Kruskal–Wallis test with a significance cutoff <0.05 for both the archaeal (C) and the bacterial (D) communities.
Figure 3
Figure 3
Principal coordinate analysis (PCoA) based on Bray–Curtiss dissimilarity of the archaeal (A,B) and bacterial (C,D) communities. Plots A and C are based on all hosts, while plots B and D show only the marine hosts (A. aerophoba, A. aurita, H. panicea, and M. leidyi). For the different H. panicea subsamples (seasons), these have been plotted either as circle (June) or as square (November). Only ASVs and BSVs with an abundance of >0.01% in at least one sample were considered. No initial data transformation was applied. The relative contribution (eigenvalue) of each axis to the total inertia in the data is indicated as percentage in the axis titles.
Figure 4
Figure 4
Indicator (A,B) and association network analysis (C) on the bacterial and archaeal community in the marine hosts. (A) Bacterial and (B) archaeal indicators (>0.1%) for each host are colored by phylum. GTDB taxonomy is added where divergent from the SILVA database. Taxa with an abundance >1% are plotted by size relative to their average abundance in the dataset. Edge lengths indicate the association strength to the target, where larger distances are less strongly associated. (C) Association networks calculated using both the bacterial and archaeal communities and plotted using three different main aspects. Left: Network highlighting the bacterial (blue) and archaeal (yellow) domain. Middle: The same network but with node sizes adjusted to the number of degrees (connections) to other taxa. The most connected nodes are highlighted in red. Nodes are colored to reflect their phylum affiliation. All taxa which do not occur as indicator taxa are opaque. Right: Nodes are colored according to the six modules identified through NetCoMi analysis and correspond roughly to each host. Size of the bubbles is scaled according to their betweenness values. Nodes with the highest betweenness are highlighted by blue circles. Known symbionts, abundant taxa, and key species from the association networks are highlighted by name.

Similar articles

References

    1. Andersen K. S., Kirkegaard R. H., Karst S. M., Albertsen M. (2018). ampvis2: an R package to analyse and visualise 16S rRNA amplicon data. bioRxiv:299537. doi: 10.1101/299537 - DOI
    1. Bang C., Schmitz R. A. (2018). Archaea: forgotten players in the microbiome. Emerg. Top. Life Sci. 2, 459–468. doi: 10.1042/ETLS20180035 - DOI - PubMed
    1. Barnett D. J. M., Arts I. C. W., Penders J. (2021). microViz: an R package for microbiome data visualization and statistics. J. Open Source Softw. 6:3201. doi: 10.21105/joss.03201 - DOI
    1. Bayer K., Jahn M. T., Slaby B. M., Moitinho-Silva L., Hentschel U. (2018). Marine sponges as Chloroflexi hot spots: genomic insights and high-resolution visualization of an abundant and diverse symbiotic clade. mSystems 3:e00150-18. doi: 10.1128/mSystems.00150-18 - DOI - PMC - PubMed
    1. Bayer K., Kamke J., Hentschel U. (2014). Quantification of bacterial and archaeal symbionts in high and low microbial abundance sponges using real-time PCR. FEMS Microbiol. Ecol. 89, 679–690. doi: 10.1111/1574-6941.12369 - DOI - PubMed

LinkOut - more resources