

Metabolomic and microbiome analysis of cervicovaginal mucus in in vitro fertilization-embryo transfer: Toward predicting pregnancy success
- PMID: 38476960
- PMCID: PMC10927931
- DOI: 10.1002/rmb2.12568
Metabolomic and microbiome analysis of cervicovaginal mucus in in vitro fertilization-embryo transfer: Toward predicting pregnancy success
Abstract
Purpose: In the context of in vitro fertilization-embryo transfer (IVF-ET), factors other than egg quality may be key determinants of treatment success, in particular, maternal factors related to uterine endometrial receptivity and unidentified factors. We therefore aimed to analyze the metabolome and microbiome in IVF-ET patients who did and did not achieve pregnancy.
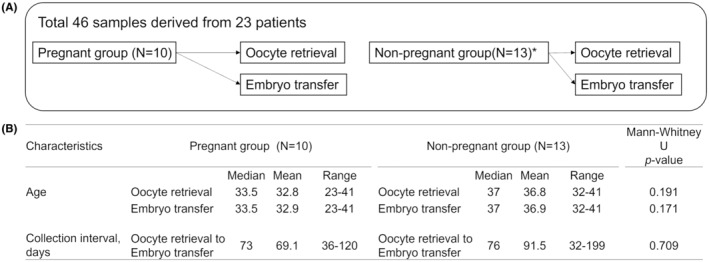
Methods: Cervicovaginal mucus was collected from patients undergoing IVF-ET. Metabolite analysis was conducted by liquid chromatography-mass spectrometry and the microbiota were determined by the polymerase chain reaction using universal 16S-rRNA gene bacterial primers by MiSeq sequencing. Patients were classified as pregnant (N = 10) or nonpregnant (N = 13). Metabolic pathways were examined by MetaboAnalyst.
Results: Three metabolic pathways, including alanine-aspartate-glutamate metabolism, arginine biosynthesis, and cysteine-methionine metabolism, were commonly decreased at the time of embryo transfer irrespective pregnant outcomes. Notably, pyruvate was decreased in the pregnant group. Amino acid metabolites showed inverse correlations with the presence of anaerobic microbiota in the nonpregnant group.
Conclusions: Metabolism decreased during embryo transplantation, with a notable decrease in pyruvate metabolism, particularly in patients who became pregnant. The behavior of metabolites in the pregnant and nonpregnant groups suggests that metabolome analysis in the cervicovaginal mucus may be a diagnostic marker for predicting pregnancy.
Keywords: in vitro fertilization–embryo transfer; metabolome; microbiome; mucus; pyruvate.
© 2024 The Authors. Reproductive Medicine and Biology published by John Wiley & Sons Australia, Ltd on behalf of Japan Society for Reproductive Medicine.
Conflict of interest statement
The authors declare no conflict of interest.
Figures


Similar articles
-
The vaginal microbiome as a predictor for outcome of in vitro fertilization with or without intracytoplasmic sperm injection: a prospective study.Hum Reprod. 2019 Jun 4;34(6):1042-1054. doi: 10.1093/humrep/dez065. Hum Reprod. 2019. PMID: 31119299
-
An integrative analysis of endometrial steroid metabolism and transcriptome in relation to endometrial receptivity in in vitro fertilization patients.F S Sci. 2023 Aug;4(3):219-228. doi: 10.1016/j.xfss.2023.04.003. Epub 2023 May 2. F S Sci. 2023. PMID: 37142054 Clinical Trial.
-
Detection of endometrial and subendometrial vasculature on the day of embryo transfer and prediction of pregnancy during fresh in vitro fertilization cycles.Taiwan J Obstet Gynecol. 2014 Sep;53(3):360-5. doi: 10.1016/j.tjog.2013.05.007. Taiwan J Obstet Gynecol. 2014. PMID: 25286791
-
Guidelines for the number of embryos to transfer following in vitro fertilization No. 182, September 2006.Int J Gynaecol Obstet. 2008 Aug;102(2):203-16. doi: 10.1016/j.ijgo.2008.01.007. Int J Gynaecol Obstet. 2008. PMID: 18773532 Review.
-
Impact of Endometrial Receptivity Analysis on Pregnancy Outcomes In Patients Undergoing Embryo Transfer: A Systematic Review and Meta-Analysis.J Assist Reprod Genet. 2023 May;40(5):985-994. doi: 10.1007/s10815-023-02791-2. Epub 2023 Apr 12. J Assist Reprod Genet. 2023. PMID: 37043134 Free PMC article.
Cited by
-
Methodological approaches in 16S sequencing of female reproductive tract in fertility patients: a review.J Assist Reprod Genet. 2025 Jan;42(1):15-37. doi: 10.1007/s10815-024-03292-6. Epub 2024 Oct 21. J Assist Reprod Genet. 2025. PMID: 39433639 Free PMC article. Review.
References
-
- Simón C. Endometrial factor testing is a useful tool in clinical infertility management. Reprod Biomed Online. 2022;44(6):953–960. - PubMed
LinkOut - more resources
Full Text Sources