Diet Mediate the Impact of Host Habitat on Gut Microbiome and Influence Clinical Indexes by Modulating Gut Microbes and Serum Metabolites
- PMID: 38477427
- PMCID: PMC11109649
- DOI: 10.1002/advs.202310068
Diet Mediate the Impact of Host Habitat on Gut Microbiome and Influence Clinical Indexes by Modulating Gut Microbes and Serum Metabolites
Abstract
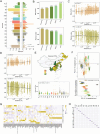
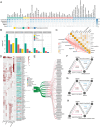
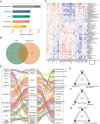
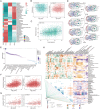
The impact of external factors on the human gut microbiota and how gut microbes contribute to human health is an intriguing question. Here, the gut microbiome of 3,224 individuals (496 with serum metabolome) with 109 variables is studied. Multiple analyses reveal that geographic factors explain the greatest variance of the gut microbiome and the similarity of individuals' gut microbiome is negatively correlated with their geographic distance. Main food components are the most important factors that mediate the impact of host habitats on the gut microbiome. Diet and gut microbes collaboratively contribute to the variation of serum metabolites, and correlate to the increase or decrease of certain clinical indexes. Specifically, systolic blood pressure is lowered by vegetable oil through increasing the abundance of Blautia and reducing the serum level of 1-palmitoyl-2-palmitoleoyl-GPC (16:0/16:1), but it is reduced by fruit intake through increasing the serum level of Blautia improved threonate. Besides, aging-related clinical indexes are also closely correlated with the variation of gut microbes and serum metabolites. In this study, the linkages of geographic locations, diet, the gut microbiome, serum metabolites, and physiological indexes in a Chinese population are characterized. It is proved again that gut microbes and their metabolites are important media for external factors to affect human health.
Keywords: China population; diet; geography location; gut microbiome; physiological indexes; serum metabolome.
© 2024 The Authors. Advanced Science published by Wiley‐VCH GmbH.
Conflict of interest statement
The authors declare no conflict of interest.
Figures


Similar articles
-
The Food-gut Human Axis: The Effects of Diet on Gut Microbiota and Metabolome.Curr Med Chem. 2019;26(19):3567-3583. doi: 10.2174/0929867324666170428103848. Curr Med Chem. 2019. PMID: 28462705 Review.
-
Impact of Dietary Resistant Starch on the Human Gut Microbiome, Metaproteome, and Metabolome.mBio. 2017 Oct 17;8(5):e01343-17. doi: 10.1128/mBio.01343-17. mBio. 2017. PMID: 29042495 Free PMC article.
-
Gut Microbiome and Serum Metabolome Alterations Associated with Isolated Dystonia.mSphere. 2021 Aug 25;6(4):e0028321. doi: 10.1128/mSphere.00283-21. Epub 2021 Aug 4. mSphere. 2021. PMID: 34346706 Free PMC article.
-
The Relationship Between Diet, Gut Microbiota, and Serum Metabolome of South Asian Infants at 1 Year.J Nutr. 2023 Feb;153(2):470-482. doi: 10.1016/j.tjnut.2022.12.016. Epub 2022 Dec 27. J Nutr. 2023. PMID: 36894240
-
Microbial Contribution to the Human Metabolome: Implications for Health and Disease.Annu Rev Pathol. 2020 Jan 24;15:345-369. doi: 10.1146/annurev-pathol-020117-043559. Epub 2019 Oct 17. Annu Rev Pathol. 2020. PMID: 31622559 Free PMC article. Review.
Cited by
-
DnaK of Parvimonas micra extracellular vesicles interacts with the host fibroblasts BAG3-IKK-γ axis to accelerate TNF-α secretion in oral lichen planus.Microbiome. 2025 Jul 14;13(1):164. doi: 10.1186/s40168-025-02151-5. Microbiome. 2025. PMID: 40660385 Free PMC article.
-
Effect of Spirulina on the Rumen Microbiota and Serum Biochemical Parameters of Lambs.Microorganisms. 2024 Dec 1;12(12):2473. doi: 10.3390/microorganisms12122473. Microorganisms. 2024. PMID: 39770676 Free PMC article.
-
Correction of Batch Effect in Gut Microbiota Profiling of ASD Cohorts from Different Geographical Origins.Biomedicines. 2024 Oct 15;12(10):2350. doi: 10.3390/biomedicines12102350. Biomedicines. 2024. PMID: 39457661 Free PMC article.
-
Machine learning integrates region-specific microbial signatures to distinguish geographically adjacent populations within a province.Front Microbiol. 2025 Jul 11;16:1586195. doi: 10.3389/fmicb.2025.1586195. eCollection 2025. Front Microbiol. 2025. PMID: 40718818 Free PMC article.
-
A systematic framework for understanding the microbiome in human health and disease: from basic principles to clinical translation.Signal Transduct Target Ther. 2024 Sep 23;9(1):237. doi: 10.1038/s41392-024-01946-6. Signal Transduct Target Ther. 2024. PMID: 39307902 Free PMC article. Review.
References
-
- a) Zhernakova A., Kurilshikov A., Bonder M. J., Tigchelaar E. F., Schirmer M., Vatanen T., Mujagic Z., Vila A. V., Falony G., Vieira‐Silva S., Wang J., Imhann F., Brandsma E., Jankipersadsing S. A., Joossens M., Cenit M. C., Deelen P., Swertz M. A., Weersma R. K., Feskens E. J., Netea M. G., Gevers D., Jonkers D., Franke L., Aulchenko Y. S., Huttenhower C., Raes J., Hofker M. H., Xavier R. J., Wijmenga C., et al., Science 2016, 352, 565; - PMC - PubMed
- b) Gaulke C. A., Sharpton T. J., Nat. Med. 2018, 24, 1495,; - PubMed
- c) Vatanen T., Plichta D. R., Somani J., Münch P. C., Arthur T. D., Hall A. B., Rudolf S., Oakeley E. J., Ke X., Young R. A., Haiser H. J., Kolde R., Yassour M., Luopajärvi K., Siljander H., Virtanen S. M., Ilonen J., Uibo R., Tillmann V., Mokurov S., Dorshakova N., Porter J. A., McHardy A. C., Lähdesmäki H., Vlamakis H., Huttenhower C., Knip M., Xavier R. J., Nat. Microbiol. 2019, 4, 470; - PMC - PubMed
- d) Gacesa R., Kurilshikov A., Vich Vila A., Sinha T., Klaassen M. A. Y., Bolte L. A., Andreu‐Sánchez S., Chen L., Collij V., Hu S., Dekens J. A. M., Lenters V. C., Björk J. R., Swarte J. C., Swertz M. A., Jansen B. H., Gelderloos‐Arends J., Jankipersadsing S., Hofker M., Vermeulen R. C. H., Sanna S., Harmsen H. J. M., Wijmenga C., Fu J., Zhernakova A., Weersma R. K., Nature 2022, 604, 732; - PubMed
- e) Kurilshikov A., Medina‐Gomez C., Bacigalupe R., Radjabzadeh D., Wang J., Demirkan A., Le Roy C. I., Raygoza Garay J. A., Finnicum C. T., Liu X., Zhernakova D. V., Bonder M. J., Hansen T. H., Frost F., Rühlemann M. C., Turpin W., Moon J. Y., Kim H. N., Lüll K., Barkan E., Shah S. A., Fornage M., Szopinska‐Tokov J., Wallen Z. D., Borisevich D., Agreus L., Andreasson A., Bang C., Bedrani L., Bell J. T., et al., Nat. Genet. 2021, 53, 156. - PMC - PubMed
-
- a) Breuninger T. A., Wawro N., Breuninger J., Reitmeier S., Clavel T., Six‐Merker J., Pestoni G., Rohrmann S., Rathmann W., Peters A., Grallert H., Meisinger C., Haller D., Linseisen J., Microbiome 2021, 9, 61; - PMC - PubMed
- b) Asnicar F., Berry S. E., Valdes A. M., Nguyen L. H., Piccinno G., Drew D. A., Leeming E., Gibson R., Roy C. L., Khatib H. A., Francis L., Mazidi M., Mompeo O., Valles‐Colomer M., Tett A., Beghini F., Dubois L., Bazzani D., Thomas A. M., Mirzayi C., Khleborodova A., Oh S., Hine R., Bonnett C., Capdevila J., Danzanvilliers S., Giordano F., Geistlinger L., Waldron L., Davies R., et al., Nat. Med. 2021, 27, 321; - PMC - PubMed
- c) Yatsunenko T., Rey F. E., Manary M. J., Trehan I., Dominguez‐Bello M. G., Contreras M., Magris M., Hidalgo G., Baldassano R. N., Anokhin A. P., Heath A. C., Warner B., Reeder J., Kuczynski J., Caporaso J. G., Lozupone C. A., Lauber C., Clemente J. C., Knights D., Knight R., Gordon J. I., Nature 2012, 486, 222; - PMC - PubMed
- d) Zhang X., Zhong H., Li Y., Shi Z., Ren H., Zhang Z., Zhou X., Tang S., Han X., Lin Y., Yang F., Wang D., Fang C., Fu Z., Wang L., Zhu S., Hou Y., Xu X., Yang H., Wang J., Kristiansen K., Li J., Ji L., Nature Aging 2021, 1, 87. - PubMed
-
- a) He Y., Wu W., Zheng H. M., Li P., McDonald D., Sheng H. F., Chen M. X., Chen Z. H., Ji G. Y., Zheng Z. D., Mujagond P., Chen X. J., Rong Z. H., Chen P., Lyu L. Y., Wang X., Wu C. B., Yu N., Xu Y. J., Yin J., Raes J., Knight R., Ma W. J., Zhou H. W., Nat. Med. 2018, 24, 1532; - PubMed
- b) Bramble M. S., Vashist N., Ko A., Priya S., Musasa C., Mathieu A., Spencer A., Lupamba Kasendue M., Mamona Dilufwasayo P., Karume K., Nsibu J., Manya H., Uy M. N. A., Colwell B., Boivin M., Mayambu J. P. B., Okitundu D., Droit A., Mumba Ngoyi D., Blekhman R., Tshala‐Katumbay D., Vilain E., Nat. Commun. 2021, 12, 5371; - PMC - PubMed
- c) De Filippo C., Cavalieri D., Di Paola M., Ramazzotti M., Poullet J. B., Massart S., Collini S., Pieraccini G., Lionetti P., Proc. Natl. Acad. Sci. USA 2010, 107, 14691; - PMC - PubMed
- d) Nature 2012, 486, 207. - PMC - PubMed
MeSH terms
Grants and funding
- ZR202102230369/Excellent Scientist Foundation of Shandong Province
- P30 AG066615/AG/NIA NIH HHS/United States
- R01 HD038700/HD/NICHD NIH HHS/United States
- 2021SFGC0502/Major Innovation Projects in Shandong Province
- P30-DK056350/DK/NIDDK NIH HHS/United States
- R01 DK104371/DK/NIDDK NIH HHS/United States
- R01 AG065357/AG/NIA NIH HHS/United States
- R01-DK104371/DK/NIDDK NIH HHS/United States
- R01-HD30880/Eunice Kennedy Shriver National Institute of Child Health and Human Development
- R01 HL108427/HL/NHLBI NIH HHS/United States
- D43 TW009077/TW/FIC NIH HHS/United States
- 82071122/National Natural Science Foundation of China
- 2021YFE0114200/Ministry of Science and Technology of the People's Republic of China
- R01-HD38700/Eunice Kennedy Shriver National Institute of Child Health and Human Development
- P30 DK056350/DK/NIDDK NIH HHS/United States
- National Young Scientist Project Foundation of China (2019)
- R24 HD050924/HD/NICHD NIH HHS/United States
- 2021GXRC021/Oral Microbiome Innovation Team of Jinan City
- Program of Taishan Young from Shandong Province
- R01 HD030880/HD/NICHD NIH HHS/United States
- 2020KJK001/Oral Microbiome Innovation Team of Shandong Province
- D43 TW007709/TW/FIC NIH HHS/United States
LinkOut - more resources
Full Text Sources
