

Single-cell transcriptomic sequencing identifies subcutaneous patient-derived xenograft recapitulated medulloblastoma
- PMID: 38477441
- PMCID: PMC11904117
- DOI: 10.1002/ame2.12399
Single-cell transcriptomic sequencing identifies subcutaneous patient-derived xenograft recapitulated medulloblastoma
Abstract
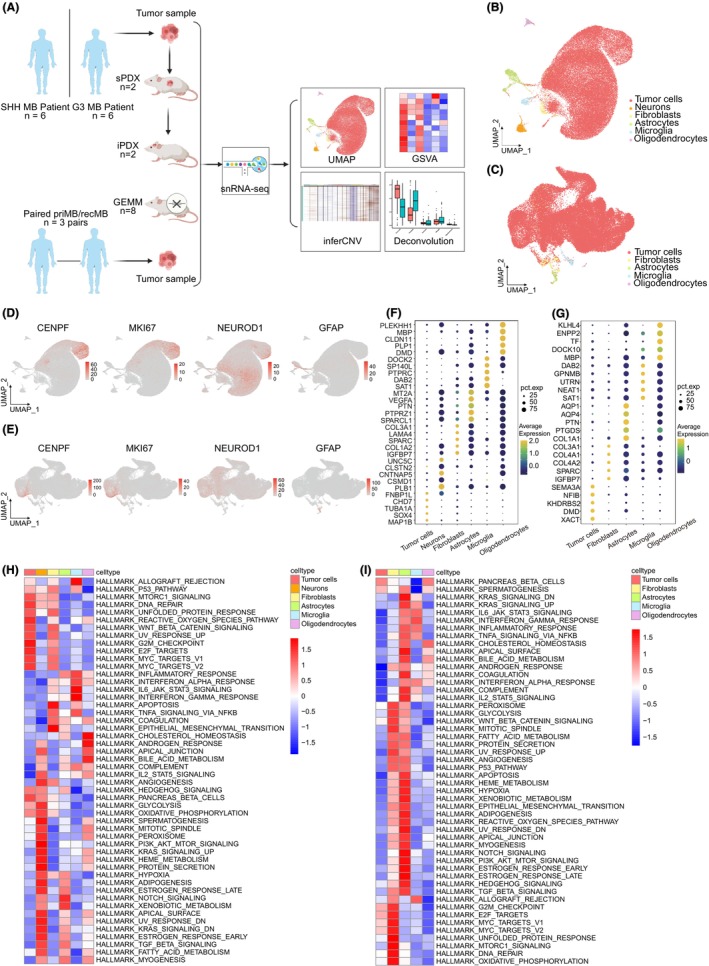
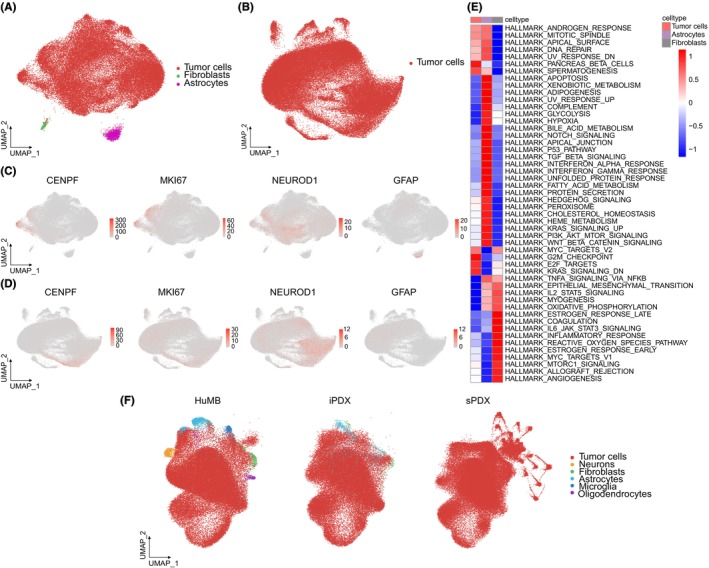
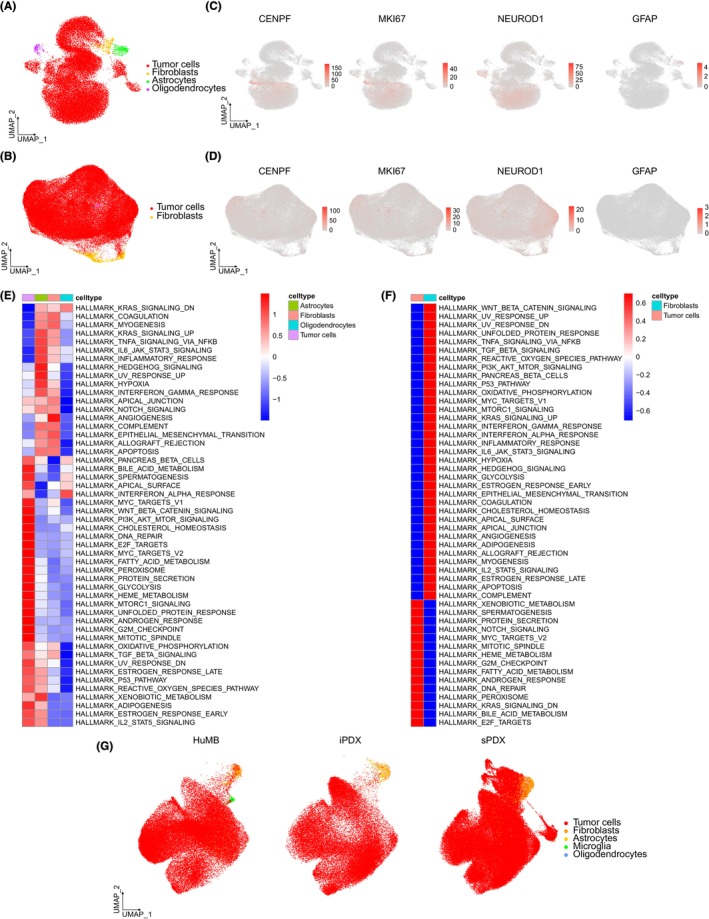
Background: Medulloblastoma (MB) is one of the most common malignant brain tumors that mainly affect children. Various approaches have been used to model MB to facilitate investigating tumorigenesis. This study aims to compare the recapitulation of MB between subcutaneous patient-derived xenograft (sPDX), intracranial patient-derived xenograft (iPDX), and genetically engineered mouse models (GEMM) at the single-cell level.
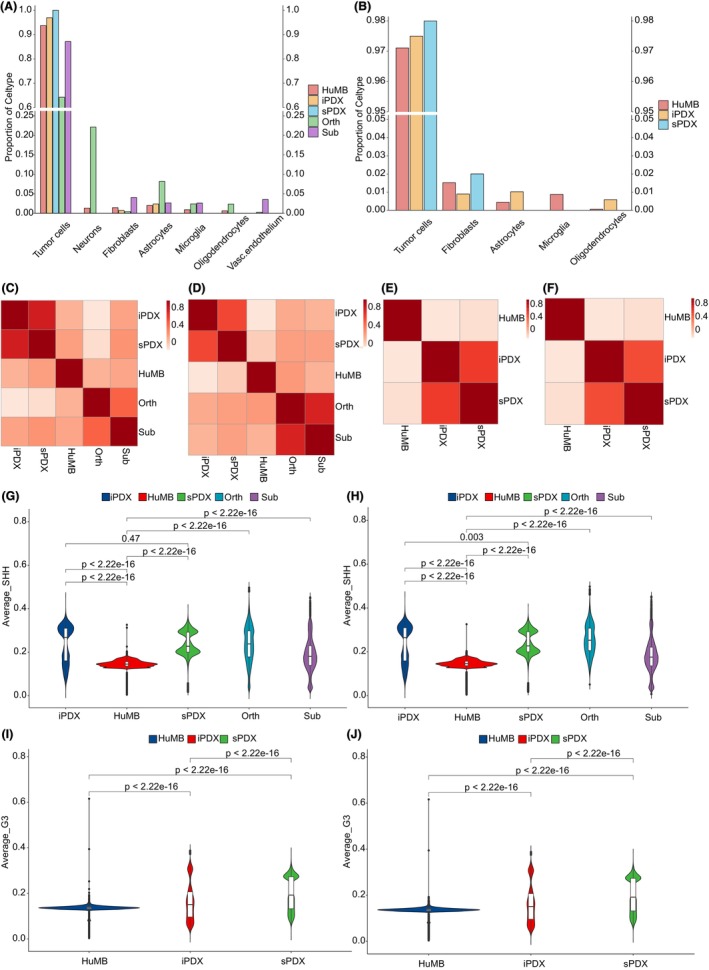
Methods: We obtained primary human sonic hedgehog (SHH) and group 3 (G3) MB samples from six patients. For each patient specimen, we developed two sPDX and iPDX models, respectively. Three Patch+/- GEMM models were also included for sequencing. Single-cell RNA sequencing was performed to compare gene expression profiles, cellular composition, and functional pathway enrichment. Bulk RNA-seq deconvolution was performed to compare cellular composition across models and human samples.
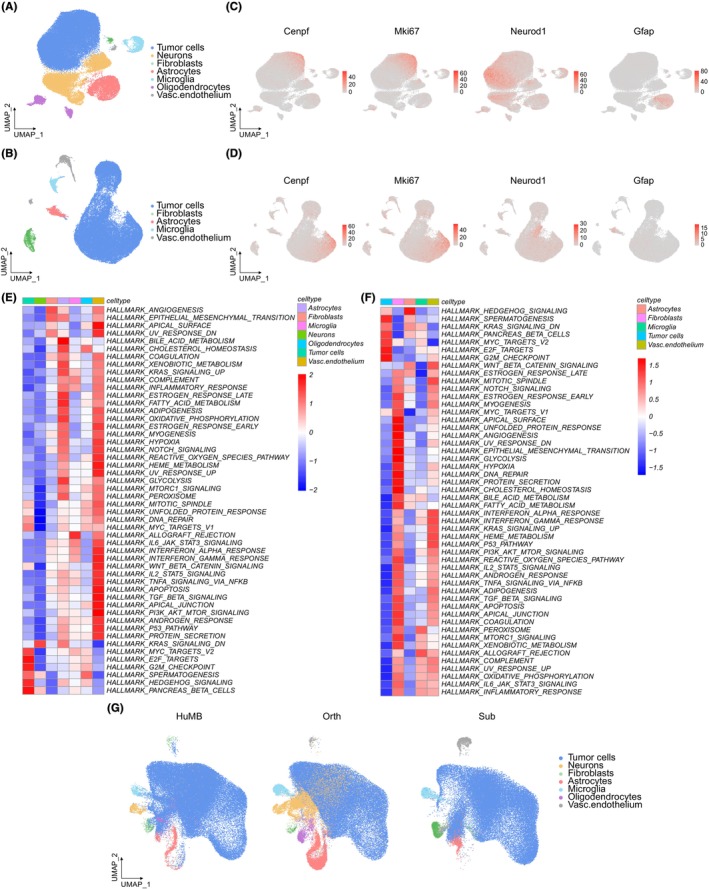
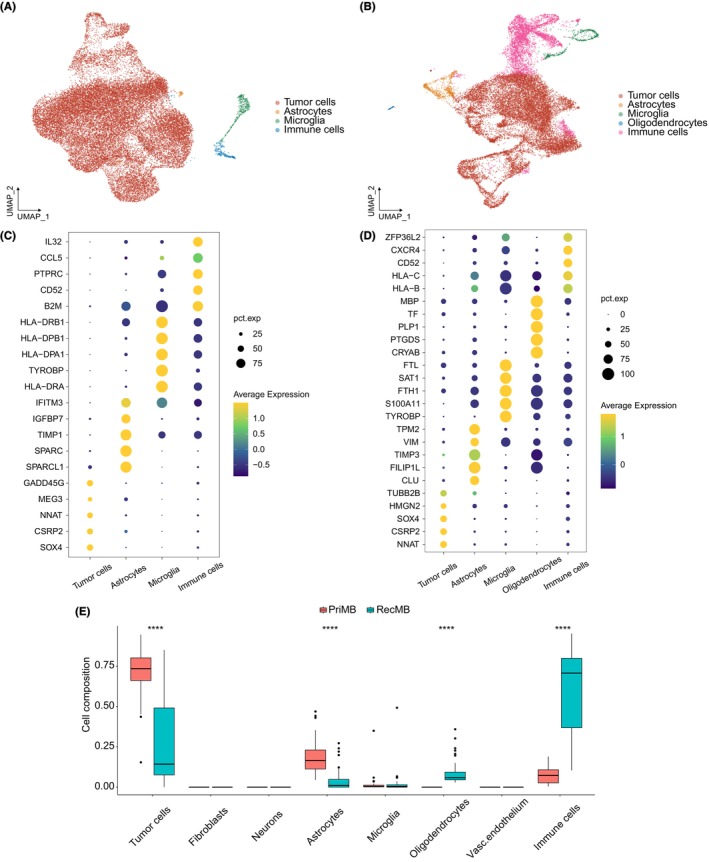
Results: Our results showed that the sPDX tumor model demonstrated the highest correlation to the overall transcriptomic profiles of primary human tumors at the single-cell level within the SHH and G3 subgroups, followed by the GEMM model and iPDX. The GEMM tumor model was able to recapitulate all subpopulations of tumor microenvironment (TME) cells that can be clustered in human SHH tumors, including a higher proportion of tumor-associated astrocytes and immune cells, and an additional cluster of vascular endothelia when compared to human SHH tumors.
Conclusions: This study was the first to compare experimental models for MB at the single-cell level, providing value insights into model selection for different research purposes. sPDX and iPDX are suitable for drug testing and personalized therapy screenings, whereas GEMM models are valuable for investigating the interaction between tumor and TME cells.
Keywords: experimental models; medulloblastoma; sPDX; single‐cell sequencing.
© 2024 The Authors. Animal Models and Experimental Medicine published by John Wiley & Sons Australia, Ltd on behalf of The Chinese Association for Laboratory Animal Sciences.
Conflict of interest statement
The authors declare that they have no competing interests.
Figures
Similar articles
-
Enrichment of Tumor-Infiltrating B Cells in Group 4 Medulloblastoma in Children.Int J Mol Sci. 2022 May 9;23(9):5287. doi: 10.3390/ijms23095287. Int J Mol Sci. 2022. PMID: 35563678 Free PMC article.
-
LOXL1-AS1 contributes to metastasis in sonic-hedgehog medulloblastoma by promoting cancer stem-like phenotypes.J Exp Clin Cancer Res. 2024 Apr 30;43(1):130. doi: 10.1186/s13046-024-03057-0. J Exp Clin Cancer Res. 2024. PMID: 38689348 Free PMC article.
-
Subgroup-Enriched Pathways and Kinase Signatures in Medulloblastoma Patient-Derived Xenografts.J Proteome Res. 2022 Sep 2;21(9):2124-2136. doi: 10.1021/acs.jproteome.2c00203. Epub 2022 Aug 17. J Proteome Res. 2022. PMID: 35977718 Free PMC article.
-
Roles and interactions of tumor microenvironment components in medulloblastoma with implications for novel therapeutics.Genes Chromosomes Cancer. 2024 Apr;63(4):e23233. doi: 10.1002/gcc.23233. Genes Chromosomes Cancer. 2024. PMID: 38607297 Review.
-
Recent advances in SHH medulloblastoma progression: tumor suppressor mechanisms and the tumor microenvironment.F1000Res. 2019 Oct 29;8:F1000 Faculty Rev-1823. doi: 10.12688/f1000research.20013.1. eCollection 2019. F1000Res. 2019. PMID: 31700613 Free PMC article. Review.
References
MeSH terms
Substances
Grants and funding
LinkOut - more resources
Full Text Sources
Miscellaneous
