. 2024 May;11(19):e2308850.
doi: 10.1002/advs.202308850. Epub 2024 Mar 13.

Enhanced Bacterial Cuproptosis-Like Death via Reversal of Hypoxia Microenvironment for Biofilm Infection Treatment

Affiliations

Enhanced Bacterial Cuproptosis-Like Death via Reversal of Hypoxia Microenvironment for Biofilm Infection Treatment

Zhiyuan Luo et al. Adv Sci (Weinh). 2024 May.

Abstract

A recently emerging cell death pathway, known as copper-induced cell death, has demonstrated significant potential for treating infections. Existing research suggests that cells utilizing aerobic respiration, as opposed to those reliant on glycolysis, exhibit greater sensitivity to copper-induced death. Herein, a MnO2-loaded copper metal-organic frameworks platform is developed denoted as MCM, to enhance bacterial cuproptosis-like death via the remodeling of bacterial respiratory metabolism. The reversal of hypoxic microenvironments induced a cascade of responses, encompassing the reactivation of suppressed immune responses and the promotion of osteogenesis and angiogenesis. Initially, MCM catalyzed O2 production, alleviating hypoxia within the biofilm and inducing a transition in bacterial respiration mode from glycolysis to aerobic respiration. Subsequently, the sensitized bacteria, characterized by enhanced tricarboxylic acid cycle activity, underwent cuproptosis-like death owing to increased copper concentrations and aggregated intracellular dihydrolipoamide S-acetyltransferase (DLAT). The disruption of hypoxia also stimulated suppressed dendritic cells and macrophages, thereby strengthening their antimicrobial activity through chemotaxis and phagocytosis. Moreover, the nutritional effects of copper elements, coupled with hypoxia alleviation, synergistically facilitated the regeneration of bones and blood vessels. Overall, reshaping the infection microenvironment to enhance cuproptosis-like cell death presents a promising avenue for eradicating biofilms.

Keywords: biofilm; enhanced cuproptosis‐like death; hypoxia microenvironment; immunomodulation; respiratory metabolism.


Conflict of interest statement

The authors declare no conflict of interest.

Figures

Scheme 1
Scheme 1
Schematic of the preparation of MnO2 loaded copper metal–organic frameworks (MCM) and the multiple synergistic antibacterial strategies based on reshaping the infection microenvironment to enhance bacterial cuproptosis‐like death, reawakening suppressed immune responses, and promoting osteogenesis and angiogenesis.
Figure 1
Figure 1
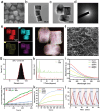
Characterization of CM and MCM. a) SEM images of CM. Scale bar, 100 nm. b,c) TEM images of MCM. Scale bar, 100 nm, 50 nm. d) SEAD of MCM. e) Elemental mapping images of MCM. Scale bar, 50 nm. f) SEM images of ECMH mixed with MCM. Scale bar, 100 nm. g) Particle size distribution of MCM. h) XRD of CM and MCM. i) UV–vis spectra of MCM at varied concentration (50, 100, 200, 400, and 800 µg mL−1). j) O2 production in H2O2 solution treated with phosphate buffered saline (PBS), MnO2, CM, and MCM. k) Temperature elevation curve of MCM solution at varied concentration (0, 100, 200, and 400 µg mL−1) upon NIR laser irradiation (P = 1 W cm−2). l) Heating and cooling curves of MCM (400 µg mL−1) after five cycles of 808 nm laser irradiation (P = 1 W cm−2). Data are presented as they are.
Figure 2
Figure 2
Antibiofilm properties of MCM. a) Representative photographs depicting bacterial colonies within S. aureus biofilms using SPM. b) Quantitative evaluation of bacterial viability via SPM. c) Digital images of the S. aureus biofilms stained with crystal violet. d) Biomass of S. aureus biofilm after different treatments. e) SEM images of S. aureus biofilms. Scale bar, 2 µm. f) Quantification analysis of 3D‐reconstructed biofilm thicknesses. g) Mean fluorescence intensity of red stained biofilms (dead bacteria). h) 3D reconstruction images presenting S. aureus biofilm stained with SYTO 9/ PI. Scale bar, 200 µm. Data are presented as mean ± S.D, n =  3, ** p < 0.01, *** p < 0.001, and **** p < 0.0001.
Figure 3
Figure 3
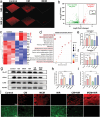
MCM remodeled bacterial respiratory metabolism and induced enhanced cuproptosis‐like death. a) Immunofluorescence images of S. aureus biofilm staining with hypoxyprobe in different groups. Scale bar, 200 µm. b) Volcano plots of differentially expressed genes (green: upregulated genes; red: downregulated genes). c) Heat map of differentially expressed genes among S. aureus biofilm treated with PBS or MCM. d) KEGG enrichment of downregulated pathways. e–f) Activity of respiratory chain complex I and II in S. aureus biofilm with different treatments. g) Western blotting results of bacterial proteins involved with cuproptosis‐like death. h) The intracellular copper concentration quantified using ICP‐OES. i) MDA content within S. aureus biofilms across different experimental groups. j) S. aureus biofilm stained with lipid peroxidation fluorescent probe (C11 BODIPY) and SytoX. Scale bar, 100 µm. Data are presented as mean ± S.D, n =  3, * p < 0.05, ** p < 0.01, and **** p < 0.0001.
Figure 4
Figure 4
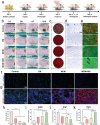
MCM reinvigorated macrophages and dendritic cells. a) Typical scatter plots of dendritic cell after treatment. b) Immunofluorescent staining of RAW264.7 macrophages. CCR7 (red, M1), CD206 (green, M2), and DAPI (blue). Scale bar, 25 µm. c) Typical visuals displaying the phagocytosis of bacteria by macrophages. Red fluorescence corresponds to macrophages, green fluorescence corresponds to S. aureus. Scale bar, 25 µm. d) Flow cytometric analysis of CD86 (M1) and CD206 (M2) expression in macrophages. e,f) Quantitative analysis of immunofluorescent results. g,h) ELISA results of proinflammatory and anti‐inflammatory cytokines (TNFα and IL‐10). Data are presented as mean ± S.D, n =  3, ** p < 0.01, *** p < 0.001, and **** p < 0.0001.
Figure 5
Figure 5
Osteogenetic and angiogenesis effects of MCM. a–c) Expression of osteogenic genes (BMP2, OCN, and RUNX2) accessed by RT‐qPCR assay. d) ALP activity measured after culturing for 7 and 14 days. e) Cellular mineralization visualized through ARS staining. Scale bar, 100 µm. f) Fluorescence images of phalloidin and DAPI co‐stained images of BMSCs. Scale bar, 100 µm. Data are presented as mean ± S.D, n =  3, * p < 0.05, ** p < 0.01, and **** p < 0.0001.
Figure 6
Figure 6
Antimicrobial activity and immunomodulatory effects of MCM in vivo. a) Schematic design of constructing IAI model and in vivo treatment procedures. b) Digital photographs of IAI models on days 1, 5, 7, 10, and 14. c) Bacterial colonies of cultures from wound tissues. d) Giemsa staining images of wound tissues. The red arrows pinpoint the stained bacteria. Scale bar, 50 µm. e) SEM images of S. aureus biofilms in vivo. Scale bar, 2 µm. f) Immunofluorescent staining of HIF‐1α with different treatments (green fluorescence indicates HIF‐1α; blue fluorescence indicates cell nucleus). Scale bar, 50 µm. g) Immunofluorescent staining of RAW264.7 cells. Red fluorescence represents iNOS (M1 macrophage marker), and green fluorescence represents Arg‐1 (M2 macrophage marker). Scale bar, 50 µm. h) Quantitative analysis of relative newborn skin and bacterial viability. i,j) Quantitative analysis of immunofluorescent results. k) ELISA results of TNFα in vivo. Data are presented as mean ± S.D, n =  6, ** p < 0.01, *** p < 0.001, and **** p < 0.0001.
Figure 7
Figure 7
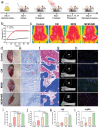
Osteogenic and Angiogenesis properties of MCM in vivo. a) Schematic design of constructing bacterial infected bone defect model and in vivo treatment procedures. b) The temperature‐increase curves of the control and MCM + NIR groups and c) the thermal images. d) Digital photos of the wound. e) Giemsa staining images of wound tissues. The red arrows pinpoint the stained bacteria. Scale bar, 50 µm. f) Masson's staining images of collagen fibers. Scale bar, 50 µm. g) 3D reconstructed micro‐CT images. h) Immunofluorescent staining of von Willibrand factor (vWF) shown in red and α‐SMA shown in green revealing vascular regeneration. Scale bar, 50 µm. i,j) Quantitative analyses of masson staining tests and bone volume. k,l) Quantitative analysis of immunofluorescent results. Data are presented as mean ± S.D, n =  6, * p < 0.05, *** p < 0.001, and **** p < 0.0001.

References

    1. a) Zhu W., Mei J., Zhang X., Zhou J., Xu D., Su Z., Fang S., Wang J., Zhang X., Zhu C., Adv. Mater. 2022, 34, 2207961; - PubMed
    2. b) Wang J., Wang L., Pan J., Zhao J., Tang J., Jiang D., Hu P., Jia W., Shi J., Adv. Sci. 2021, 8, 2004010; - PMC - PubMed
    3. c) Wang G., Feng H., Hu L., Jin W., Hao Q., Gao A., Peng X., Li W., Wong K. Y., Wang H., Li Z., Chu P. K., Nat. Commun. 2018, 9, 2055. - PMC - PubMed
    1. a) Arciola C. R., Campoccia D., Montanaro L., Nat. Rev. Microbiol. 2018, 16, 397; - PubMed
    2. b) Liu C., Niu J., Cui T., Ren J., Qu X., J. Am. Chem. Soc. 2022, 144, 19611. - PubMed
    1. a) Wang Z., Liu X., Duan Y., Huang Y., Biomaterials 2022, 280, 121249; - PubMed
    2. b) Bjarnsholt T., Whiteley M., Rumbaugh K. P., Stewart P. S., Jensen P. Ø., Frimodt‐Møller N., Lancet Infect. Dis. 2022, 22, e88. - PMC - PubMed
    1. a) Hou S., Mahadevegowda S. H., Lu D., Zhang K., Chan‐Park M. B., Duan H., Small 2020, 17, e2006357; - PubMed
    2. b) Chang M., Hou Z., Wang M., Li C., Lin J., Adv. Mater. 2020, 33, 2004788; - PubMed
    3. c) Xie Y., Liu Y., Yang J., Liu Y., Hu F., Zhu K., Jiang X., Angew. Chem. Int. Ed. 2018, 57, 3958; - PubMed
    4. d) Zhao H., Zhao C., Liu Z., Yi J., Liu X., Ren J., Qu X., Angew. Chem. Int. Ed. 2023, 62, e202303989. - PubMed
    1. a) Wu F., Ma J., Wang Y., Xie L., Yan X., Shi L., Li Y., Liu Y., ACS Nano 2023, 17, 2980; - PubMed
    2. b) Zha K., Xiong Y., Zhang W., Tan M., Hu W., Lin Z., Cheng P., Lu L., Cai K., Mi B., Feng Q., Zhao Y., Liu G., ACS Nano 2023, 17, 17199. - PubMed

Substances

LinkOut - more resources