. 2024 May;11(20):e2306297.
doi: 10.1002/advs.202306297. Epub 2024 Mar 13.

Gastrointestinal Dysmotility Predisposes to Colitis through Regulation of Gut Microbial Composition and Linoleic Acid Metabolism

Affiliations

Gastrointestinal Dysmotility Predisposes to Colitis through Regulation of Gut Microbial Composition and Linoleic Acid Metabolism

Youhua Zhang et al. Adv Sci (Weinh). 2024 May.

Abstract

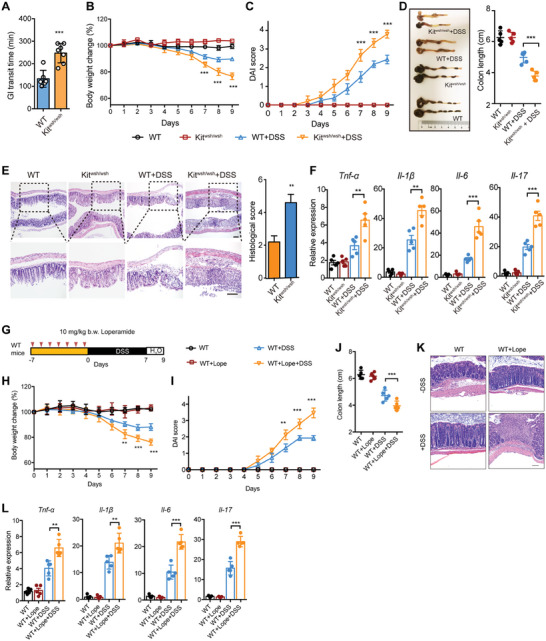
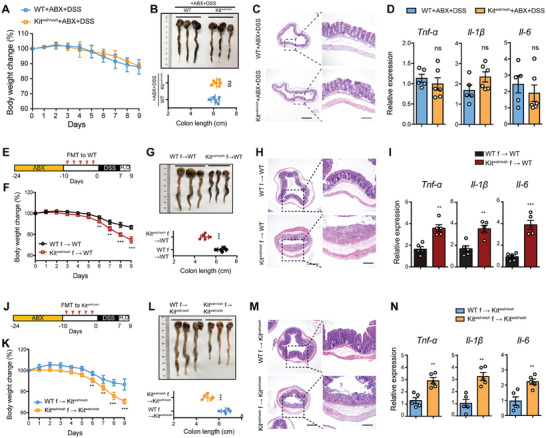
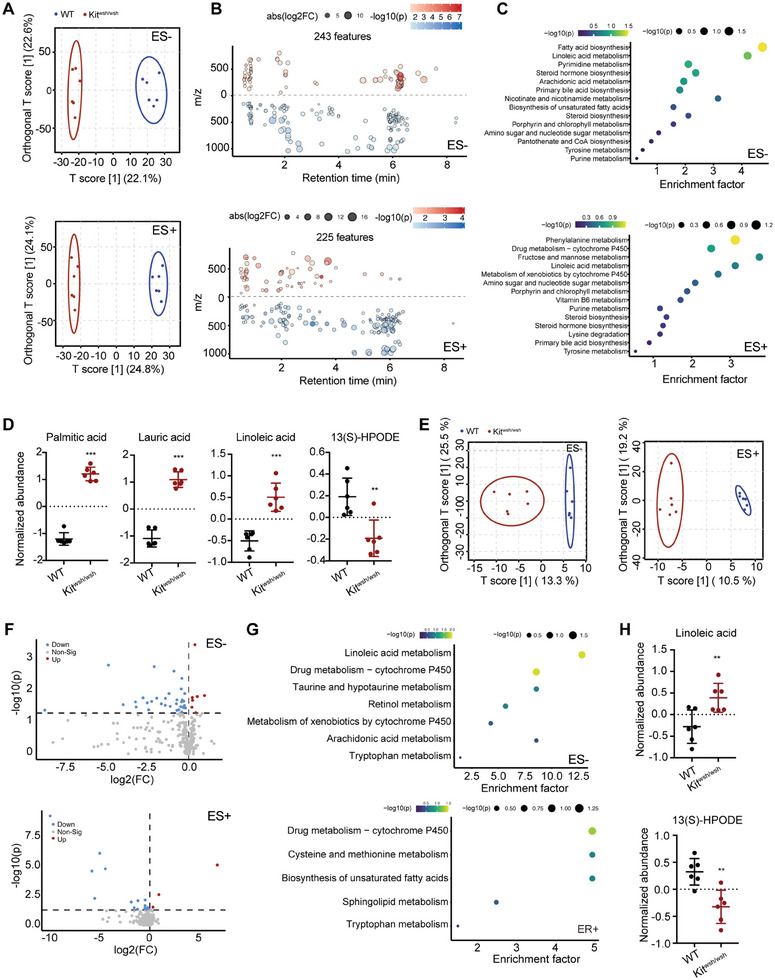
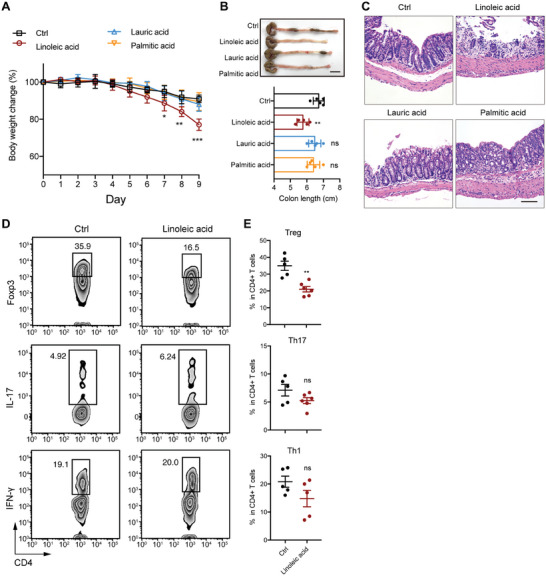
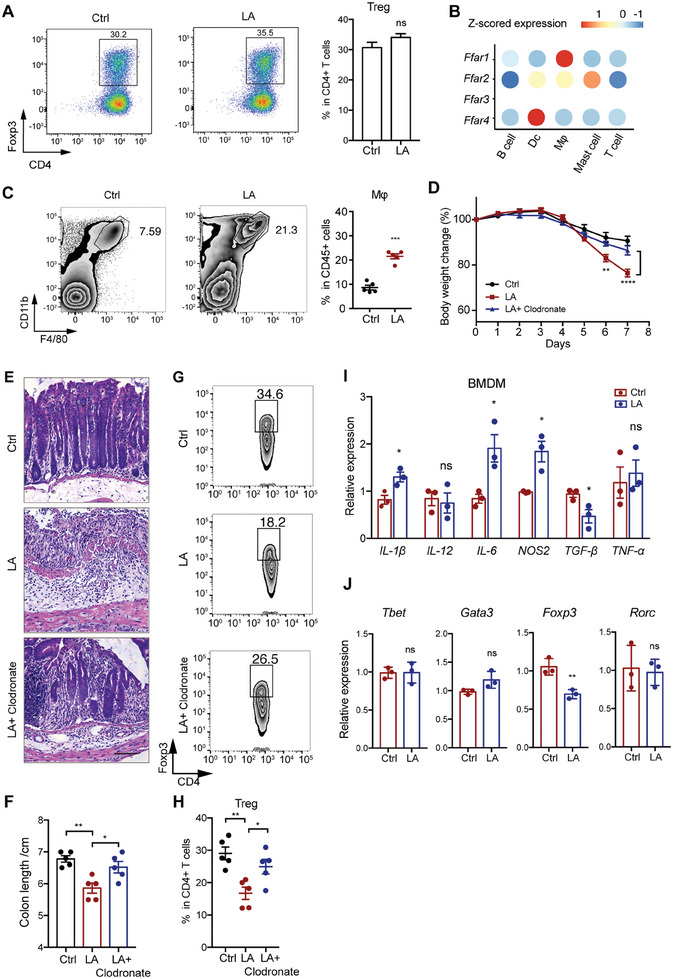
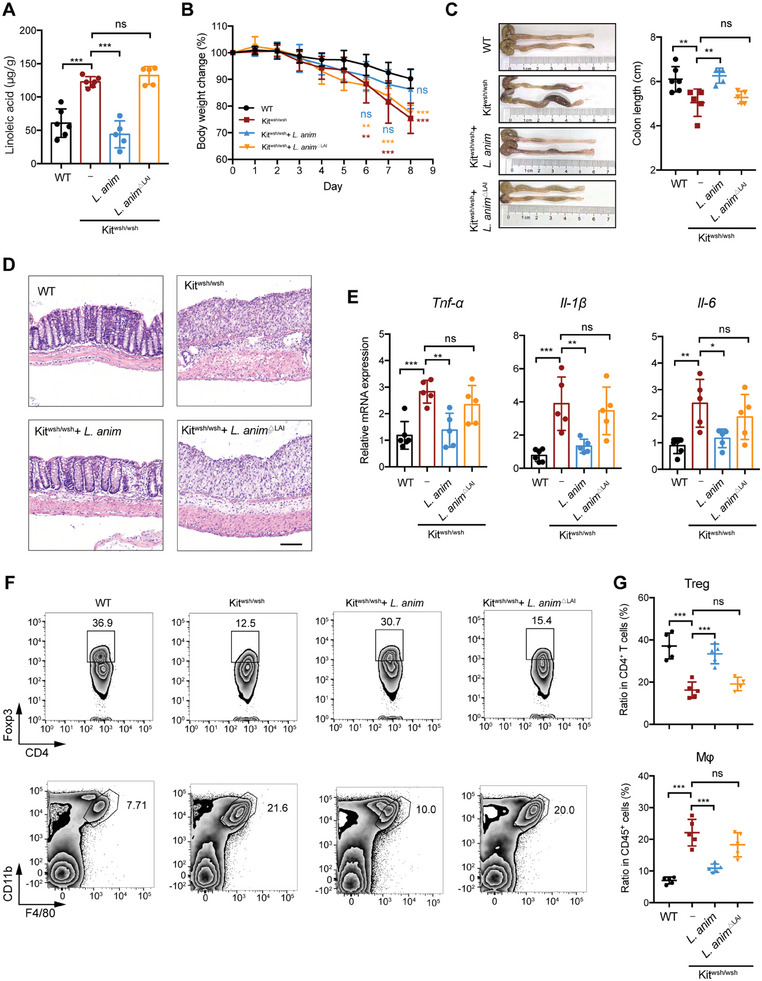
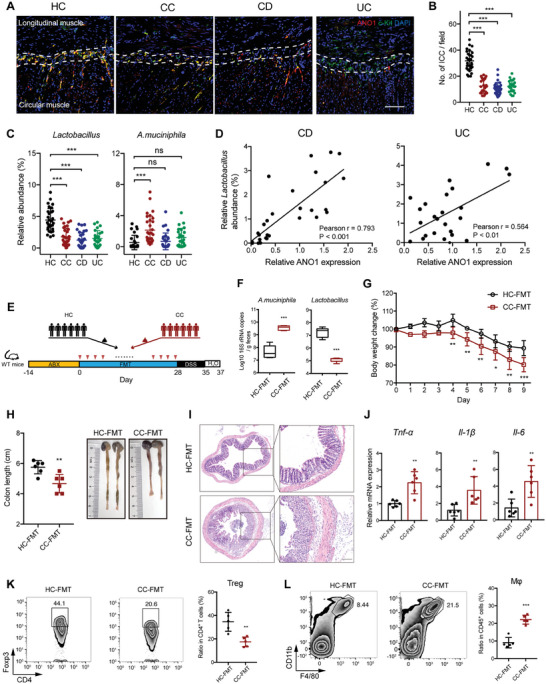
Disrupted gastrointestinal (GI) motility is highly prevalent in patients with inflammatory bowel disease (IBD), but its potential causative role remains unknown. Herein, the role and the mechanism of impaired GI motility in colitis pathogenesis are investigated. Increased colonic mucosal inflammation is found in patients with chronic constipation (CC). Mice with GI dysmotility induced by genetic mutation or chemical insult exhibit increased susceptibility to colitis, dependent on the gut microbiota. GI dysmotility markedly decreases the abundance of Lactobacillus animlalis and increases the abundance of Akkermansia muciniphila. The reduction in L. animlalis, leads to the accumulation of linoleic acid due to compromised conversion to conjugated linoleic acid. The accumulation of linoleic acid inhibits Treg cell differentiation and increases colitis susceptibility via inducing macrophage infiltration and proinflammatory cytokine expression in macrophage. Lactobacillus and A. muciniphila abnormalities are also observed in CC and IBD patients, and mice receiving fecal microbiota from CC patients displayed an increased susceptibility to colitis. These findings suggest that GI dysmotility predisposes host to colitis development by modulating the composition of microbiota and facilitating linoleic acid accumulation. Targeted modulation of microbiota and linoleic acid metabolism may be promising to protect patients with motility disorder from intestinal inflammation.

Keywords: gut microbiota; gut motility; immune cell; inflammatory bowel disease; linoleic acid.


Conflict of interest statement

The authors declare no conflict of interest.

Figures

Figure 1
Figure 1
Interstitial cells of Cajal (ICC)‐deficient and loperamide induced‐GI dysmotility increased susceptivity to DSS‐induced colitis. A) The gut transit time of WT (n = 5) and Kitwsh/wsh (n = 7) mice. B‐F) WT (n = 5) and Kitwsh/wsh mice (n = 5) were treated with 2.5% DSS for 7 days, followed by water for 2 days. B) Body weight changes were monitored daily during DSS administration. C) Disease activity index (DAI) was monitored daily during DSS administration. D) Colon lengths were measured after mice were sacrificed on day 9. E) Colon tissues were examined histologically after H&E staining and scored for inflammation and architectural distortion. Scale bars, 50 µm. F) Inflammatory gene expression was examined by QPCR after mice were sacrificed on day 9. For loperamide (Lope) induced model G–L), WT mice (n = 5/group) were gavaged with 10 mg k−1g body weight (b.w.) loperamide every day for 7 days before DSS treatment to sacrifice G). The body weight changes H), DAI I) colon lengths J), representative images of H&E‐stained colon sections K), and colonic gene expression of proinflammatory genes L) in WT mice treated with or without loperamide were monitored or analyzed. Scale bar K), 100 µm. In A‐F, H‐J and L, data represent mean ± SEM; **P < 0.01, ***P < 0.001 by two‐sided Student t test.
Figure 2
Figure 2
GI dysmotility‐induced colitis exacerbation is dependent on gut microbiota. A–D) WT (n = 5) and Kitwsh/wsh (n = 6) mice were treated with a cocktail of antibiotics (ABX) for 14 days, and then treated with 2.5% DSS. The body weight changes A), colon lengths B), representative images of H&E‐stained colon sections C), and expression of proinflammatory genes D) were monitored or analyzed. E–I) WT mice (n = 5/group) were treated with a cocktail of ABX for 14 days, and then gavaged with fecal material from WT (WT f) or Kitwsh/wsh (Kitwsh/wsh f) mice every other day for 10 days, followed by a 2.5% DSS treatment for 7 days and water 2 days. The body weight changes F), colon lengths G), representative images of H&E‐stained colon sections H), and expression of proinflammatory genes I) in WT mice receiving fecal material from WT or Kitwsh/wsh mice were monitored or analyzed. J–N) Kitwsh/wsh mice (n = 5/group) were treated with a cocktail of ABX for 14 days, and then gavaged with fecal material from WT or Kitwsh/wsh mice every other day for 10 days, followed by a 2.5% DSS treatment for 7 days and water 2 days. The body weight changes K), colon lengths L), representative images of H&E‐stained colon sections M), and colonic gene expression of proinflammatory genes N) in Kitwsh/wsh mice receiving fecal material from WT or Kitwsh/wsh mice were monitored or analyzed. Scale bars (C, H, M): left 500 µm, right 200 µm. In A, B, D, F, G, I, K, L, and N, data represent mean ± SEM; ns, not significant, **P < 0.01, ***P < 0.001 by two‐sided Student t test.
Figure 3
Figure 3
GI dysmotility altered the gut microbiota composition. A–D) 16S rRNA gene sequencing was used to analyze the stool samples from WT (n = 6) and Kitwsh/wsh (n = 6) mice. A) α‐Diversity was characterized by Shannon index and Chao index. B) β‐Diversity analysis of gut microbiota of WT and Kitwsh/wsh mice. Ordination plot based on the PCoA using Bray‐Curtis demonstrates the taxonomic variations of microbial communities across the two groups of mice. C) Differences in microbial taxa at species levels between WT and Kitwsh/wsh mice were calculated by LDA effect size (LEfSe). Mann‐Whitney test was used with a statistical significance cutoff of P < 0.05 and LDA score > 2.5. D) Relative abundances of the genus Lactobacillus, Akkermanisa and their species detected in 16S rRNA sequencing in fecal samples of WT and Kitwsh/wsh mice. E) Absolute abundances of L. animalis, L.johnsonii, and A. muciniphila in DSS treated or non‐treated WT and Kitwsh/wsh mice analyzed by QPCR. F) Representative fluorescent in situ hybridization images of Lactobacillus and A. muciniphila in duodenum, ileum and colon tissues of WT and Kitwsh/wsh mice. Scale bar, 25 µm. G) Quantification of Lactobacillus and A. muciniphila positive probes per field of F. In A, D, E and G, data represent mean ± SEM; *P < 0.05, **P < 0.01, ***P < 0.001 by two‐sided Student t test.
Figure 4
Figure 4
Linoleic acid was enriched in metabolic profiles of both fecal and colonic tissue samples from Kitwsh/wsh mice. Fecal A–D) and colonic tissue E–H) samples from WT (n = 6) and Kitwsh/wsh (n = 6) mice were subjected to untargeted metabolomics liquid chromatography–mass spectrometry analysis. A,E) OPLS‐DA score plots showing all peak features in negative (ES−) and positive (ES+) ion modes. B,F) Scatter plots B) and volcano plots F) of the peak features of metabolites that significantly changed in Kitwsh/wsh mice in ES− mode and ES+ mode. Red and blue circles indicate the significantly increased and decreased metabolites, respectively (fold change >1.5; P < 0.05), in Kitwsh/wsh mice compared with those of WT group. In B, the color tone indicates P: a dark color indicates a small P. The size of the dot indicates the fold change of corresponding peak features. C,G) Dot plots showing the enriched pathways in Kitwsh/wsh mice in ES− mode and ES+ mode. D,H) The normalized abundance of long/medium‐chain fatty acids in WT and Kitwsh/wsh mice. In D and H, data represent mean ± SEM; **P < 0.01, ***P < 0.001 by two‐sided Student t test.
Figure 5
Figure 5
Linoleic acid treatment increased the susceptivity to DSS‐induced colitis by modulating the abundance of Treg. WT mice (n = 5 for each group) were gavaged with 1 g kg−1 body weight linoleic acid, lauric acid and palmitic acid respectively every day from 14 days before DSS treatment. The body weight changes A), colon lengths B), representative images of H&E‐stained colon sections C), and colonic infiltration of Treg, Th17, Th1 D and E) in each animal group were monitored or analyzed. Scale bar in C, 100 µm. In A, B, E, data represent mean ± SEM; *P < 0.05, **P < 0.01, ***P < 0.001, ns, not significant by two‐sided Student t test E) and one‐way ANOVA with Dunnett's post hoc test A and B).
Figure 6
Figure 6
Linoleic acid inhibited Treg cell differentiation through inducing macrophage infiltration and proinflammatory cytokine expression. A) Naïve CD4+ T cells which were isolated and purified from murine spleen and treated with vehicle control or 0.05 mM linoleic acid (LA) for 3 days under the condition of 2 ng mL−1 TGF‐β and 5 ng mL−1 IL‐2. B) Dot plot of average Z‐scored expression of fatty acid receptors in intestinal immune cell subsets from the mouse single cell sequencing database Mouse Cell Altas. The color represents the Z‐scored expression of fatty acid receptors. Mφ, macrophage. Dc, dendritic cell. C) Flow cytometry analysis of macrophage infiltration in cLP from DSS treated mice with Ctrl or LA gavage. D–H) WT mice (n = 6 for each group) were gavaged with or without 1 g kg−1 body weight LA every day from 14 days before DSS treatment. To deplete macrophages, clodronate was administrated 3 days before and every 2 days during DSS treatment. The body weight changes D), representative images of H&E‐stained colon sections E), colon lengths F), and infiltration of Treg G and H) in each group were monitored or analyzed. I) QPCR analysis of cytokine expression in bone marrow derived macrophages (BMDMs) treated with or without LA for 3 days. J) QPCR analysis of naïve CD4+ T cells treated with conditioned media from BMDMs in I. Scale bar (E), 50 µm. In A, C, D, F, H‐J, data represent mean ± SEM; *P < 0.05, **P < 0.01, ***P < 0.001, ns, not significant by two‐sided Student t test (A, C, I and J), one‐way ANOVA with Dunnett's post hoc test (D, F and H).
Figure 7
Figure 7
L. animalis mitigated the susceptivity to colitis, which is dependent on its ability to convert LA. Kitwsh/wsh mice (n = 5/group) were gavaged with PBS, L. animali (L. anim) or L. anim △LAI for 4 weeks, followed by a 2.5% DSS treatment for 7 days and water 1 day. WT mice (n = 6) served as control. A) GC–MS quantification of the amount of LA in feces from WT, Kitwsh/wsh, Kitwsh/wsh receiving L. anim, and Kitwsh/wsh receiving L. anim △LAI mice. B–G) The body weight changes B), colon lengths C), representative images of H&E‐stained colon sections D), proinflammatory cytokine expression E) and infiltration of Treg and Mφ in colonic tissue F and G) were monitored or analyzed. Scale bar (D), 100 µm. In A‐C, E, and G, data represent mean ± SD; *P < 0.05, **P < 0.01, ***P < 0.001, ns, not significant by one‐way ANOVA with Dunnett's post hoc test.
Figure 8
Figure 8
Fecal microbiota was altered in patients with CC, which increased susceptibility to colitis. A) Representative images of interstitial cells of Cajal (ICC) in myenteric plexus (located between the longitudinal muscle and circular muscle) stained using anti‐Anoctamin‐1 (ANO1) and anti‐c‐Kit antibody in colon tissues from CC (n = 30), inflamed region from CD patients (n = 32) and UC patients (n = 25), and normal adjacent tissue from CRC patients (n = 30). Scale bar, 100 µm. B) The number of ICCs per field in A. C) Relative abundance of Lactobacillus and A. muciniphila in stool samples from healthy donors (HC), CC, CD and UC patients. D) The correlation between the relative abundance of Lactobacillus with the expression of ANO1 in inflamed colon tissue from CD and UC patients. E) Experimental scheme of fecal microbiota transfer (FMT). WT mice (n = 6/group) were treated with a cocktail of antibiotics (ABX) for 14 days, and then gavaged with fecal microbiota pooled from 6 healthy controls (HC‐FMT) or 6 patients with chronic constipation (CC‐FMT) every other day for 4 weeks, followed by a 2.5% DSS treatment for 7 days and water 2 days. F) QPCR analysis of the abundance of A. muciniphila and Lactobacillus in fecal sample from mice receiving FMT. G–L) The body weight changes G), colon lengths H), representative images of H&E‐stained colon sections I), proinflammatory cytokine expression J) and infiltration of Treg K) and macrophage (Mφ) L) in colonic tissue were monitored or analyzed. Scale bar I), 100 µm. In B, C, F‐H, and J‐L, data represent means ± SD; *P < 0.05, **P < 0.01, ***P < 0.001 by one‐way ANOVA with Dunnett's post hoc test (B and C) and two‐sided Student t test (F‐H, and J‐L).

Similar articles

Cited by

References

    1. a) Aniwan S., Park S. H., Loftus E. V. Jr., Gastroenterol Clin North Am 2017, 46, 463,; - PubMed
    2. b) Ng S. C., Shi H. Y., Hamidi N., Underwood F. E., Tang W., Benchimol E. I., Panaccione R., Ghosh S., Wu J. C. Y., Chan F. K. L., Sung J. J. Y., Kaplan G. G., Lancet 2018, 390, 2769. - PubMed
    1. Alatab S., Sepanlou S. G., Ikuta K., Vahedi H., Bisignano C., Safiri S., Sadeghi A., Nixon M. R., Abdoli A., Abolhassani H., Alipour V., Almadi M. A. H., Almasi‐Hashiani A., Anushiravani A., Arabloo J., Atique S., Awasthi A., Badawi A., Baig A. A. A., Bhala N., Bijani A., Biondi A., Borzì A. M., Burke K. E., Carvalho F., Daryani A., Dubey M., Eftekhari A., Fernandes E., Fernandes J. C., et al., The Lancet Gastroenterology & Hepatology 2020, 5, 17. - PubMed
    1. a) Shouval D. S., Rufo P. A., JAMA Pediatr 2017, 171, 999; - PubMed
    2. b) Ramos G. P., Papadakis K. A., Mayo Clin Proc 2019, 94, 155. - PMC - PubMed
    1. Sharma R., Hudak M. L., Clin Perinatol 2013, 40, 27. - PMC - PubMed
    1. a) Pastor A. C., Osman F., Teitelbaum D. H., Caty M. G., Langer J. C., J. Pediatr. Surg. 2009, 44, 251; - PubMed
    2. b) Amiel J., Sproat‐Emison E., Garcia‐Barcelo M., Lantieri F., Burzynski G., Borrego S., Pelet A., Arnold S., Miao X., Griseri P., Brooks A. S., Antinolo G., de Pontual L., Clement‐Ziza M., Munnich A., Kashuk C., West K., Wong K. K.‐Y., Lyonnet S., Chakravarti A., Tam P. K.‐H., Ceccherini I., Hofstra R. M. W., Fernandez R., Journal of Medical Genetics 2008, 45, 1. - PubMed

Supplementary concepts

LinkOut - more resources