. 2024 Jun;11(21):e2308698.
doi: 10.1002/advs.202308698. Epub 2024 Mar 13.

A Multifunctional Therapeutic Strategy Using P7C3 as A Countermeasure Against Bone Loss and Fragility in An Ovariectomized Rat Model of Postmenopausal Osteoporosis

Affiliations

A Multifunctional Therapeutic Strategy Using P7C3 as A Countermeasure Against Bone Loss and Fragility in An Ovariectomized Rat Model of Postmenopausal Osteoporosis

Fei Wei et al. Adv Sci (Weinh). 2024 Jun.

Abstract

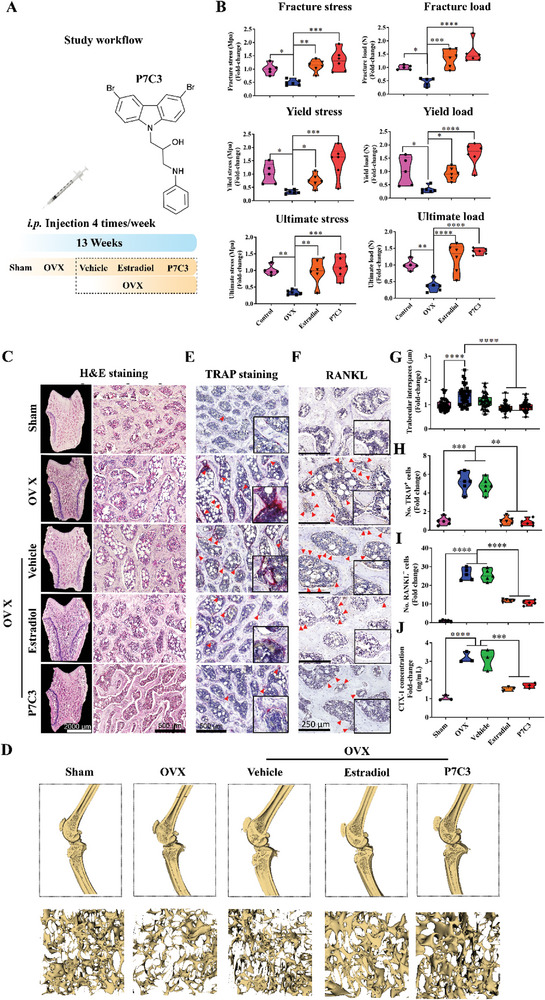
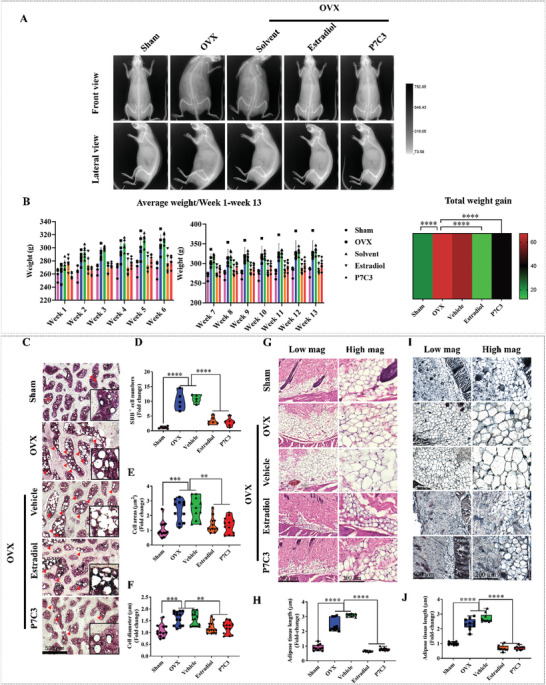
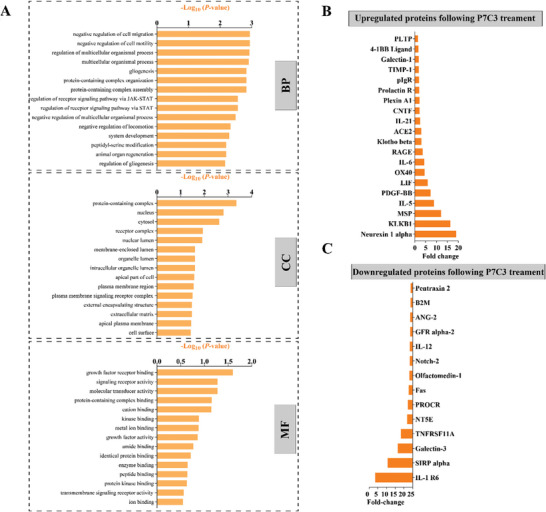
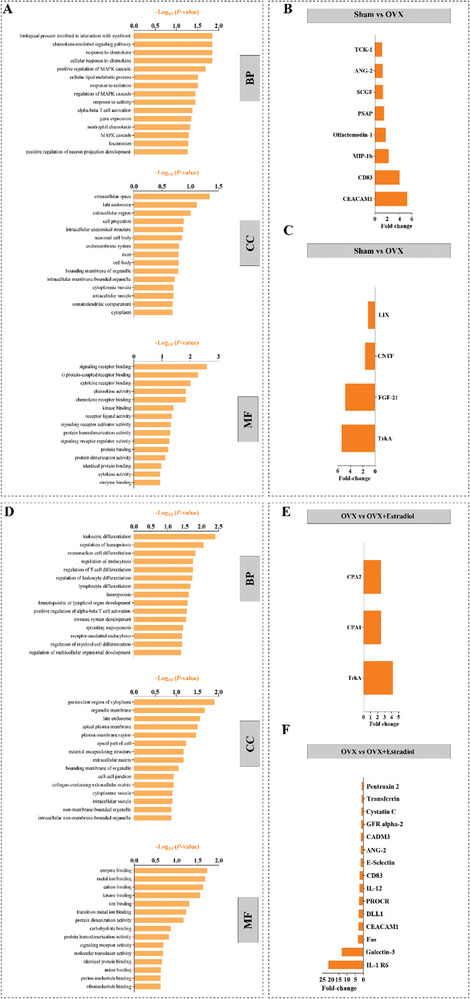
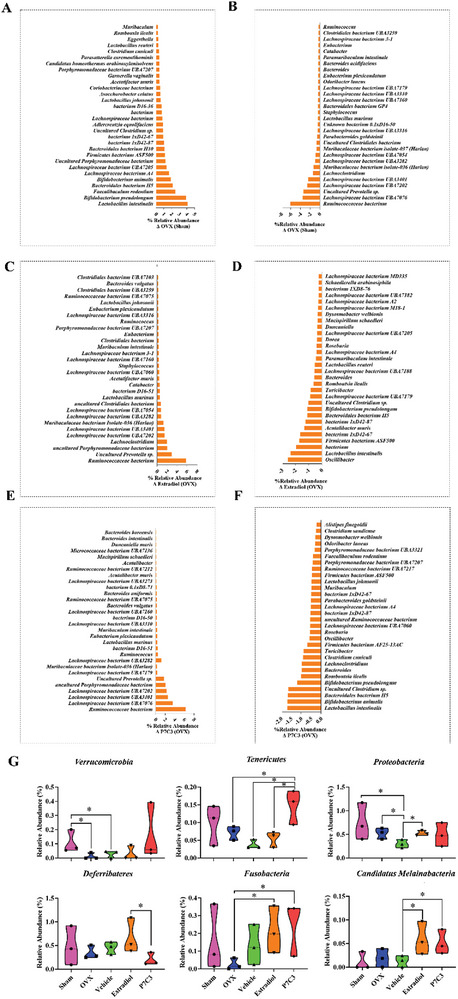
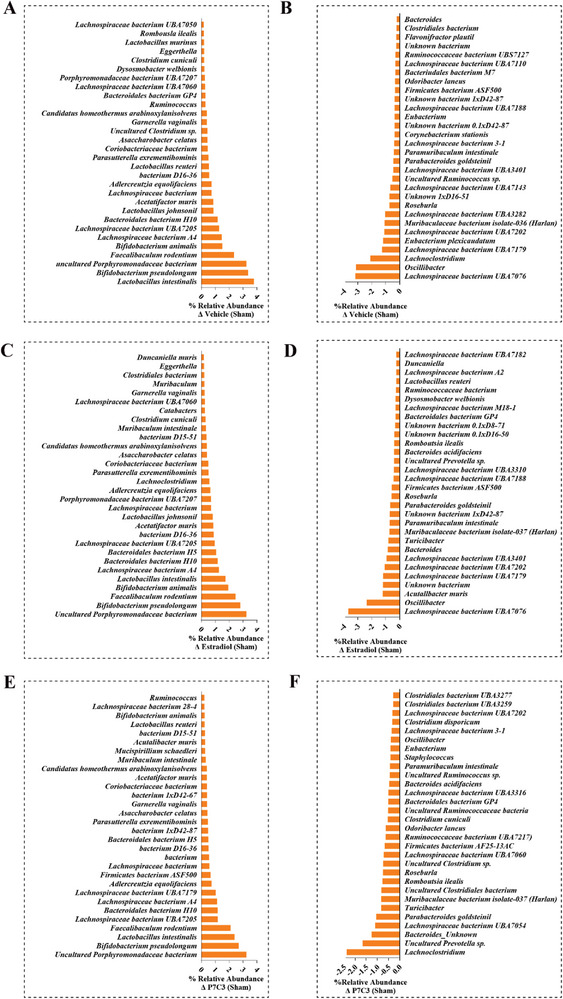
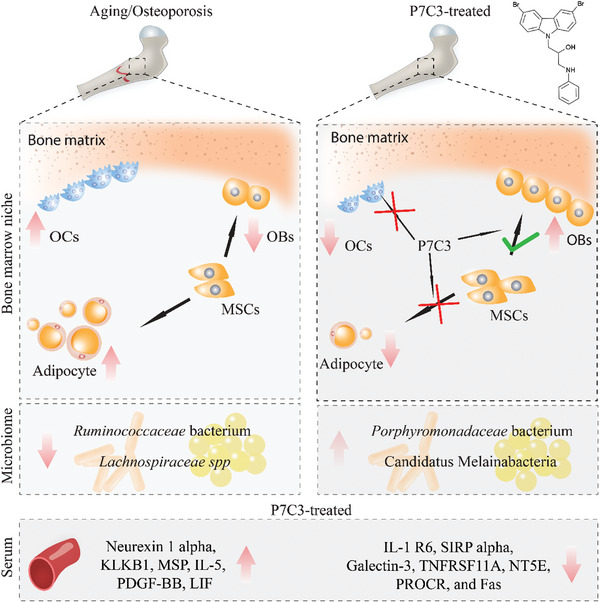
By 2060, an estimated one in four Americans will be elderly. Consequently, the prevalence of osteoporosis and fragility fractures will also increase. Presently, no available intervention definitively prevents or manages osteoporosis. This study explores whether Pool 7 Compound 3 (P7C3) reduces progressive bone loss and fragility following the onset of ovariectomy (OVX)-induced osteoporosis. Results confirm OVX-induced weakened, osteoporotic bone together with a significant gain in adipogenic body weight. Treatment with P7C3 significantly reduced osteoclastic activity, bone marrow adiposity, whole-body weight gain, and preserved bone area, architecture, and mechanical strength. Analyses reveal significantly upregulated platelet derived growth factor-BB and leukemia inhibitory factor, with downregulation of interleukin-1 R6, and receptor activator of nuclear factor kappa-B (RANK). Together, proteomic data suggest the targeting of several key regulators of inflammation, bone, and adipose turnover, via transforming growth factor-beta/SMAD, and Wingless-related integration site/be-catenin signaling pathways. To the best of the knowledge, this is first evidence of an intervention that drives against bone loss via RANK. Metatranscriptomic analyses of the gut microbiota show P7C3 increased Porphyromonadaceae bacterium, Candidatus Melainabacteria, and Ruminococcaceae bacterium abundance, potentially contributing to the favorable inflammatory, and adipo-osteogenic metabolic regulation observed. The results reveal an undiscovered, and multifunctional therapeutic strategy to prevent the pathological progression of OVX-induced bone loss.

Keywords: P7C3; bone loss; bone protection; fragility fracture; osteoporosis; ovariectomy.


Conflict of interest statement

The authors declare no conflict of interest.

Figures

Figure 1
Figure 1
X‐ray photoelectron spectroscopy (XPS) analysis of P7C3 at room temperature. A] Bromide, carbon, nitrogen, and oxygen peaks were obtained in the XPS survey spectrum. B] Br 3d produced two bromide peaks (Br 3d 5/2, and Br 3d 3/2) and two oxidized bromide peaks ((OX) Br 3d 5/2, and (OX) Br 3d 3/2). C] The C1s signal produced three carbon peaks of C‐C/C‐H, C‐N and C‐OH. [D] The N1s signal identified the anilino N and carbazole N peaks.
Figure 2
Figure 2
P7C3 is non‐cytotoxic and promotes hBMSC osteogenesis while inhibiting adipogenesis. A] The MTT assay was performed to determine cell metabolic activity. hBMSCs were treated with 0, 1 or 10 µM of P7C3 for 3 days and 5 days. 1 or 10 µM of DMSO were used as a vehicle control. B] Representative confocal microscopy images of hBMSCs treated with or without 10 µM of P7C3. The cells were fixed, stained with phalloidin (red) and DAPI (blue), and examined using confocal laser scanning microscopy. C] ALP staining results of hBMSCs cultured in osteogenic induction medium supplemented with P7C3 or DMSO vehicle (day 7). Representative ALP‐stained micrographs are shown in the lower panels of each figure. D] Alizarin red S staining for mineral deposition. Mineral deposition appears bright red in color (day 14). E] Quantification of mineralized calcium nodules (day 14). F] Alizarin red S staining results (day 28). Intense mineralized calcium nodule staining was noted following 10 µM P7C3 treatment. G] Quantification of mineralized calcium nodules (day 28). H] Results from a human bone metabolism array and quantification via a heat map. hBMSCs were either treated with 10 µM DMSO or 10 µM P7C3 in osteogenic differentiation media for 21 days. The cells were collected for array analysis. I] A human TGF‐β pathway phosphorylation array and quantification via a heat map. hBMSCs were either treated with 10 µM DMSO or 10 µM P7C3 in osteogenic differentiation media for 1 h. The cells were collected for array analysis. J–L] Representative phase contrast and LipidSpot™ Lipid Droplet‐stained images of hBMSCs cultured in adipogenic induction medium supplemented with P7C3 or the DMSO vehicle for 14 days J] and 21 days L]. The quantification of LipidSpot™+ cells is presented in image K. M] Heat map of mRNA expression levels of adipogenesis‐related genes were measured after 12 days of culture. hBMSCs were cultured in adipogenic induction medium supplemented with either P7C3 or DMSO for 12 days. The gene expression of ADPOQ, SREBP‐1, CEBPA, FABP4, and LPL were investigated. *p < 0.05, **p < 0.01, ****p < 0.0001.
Figure 3
Figure 3
Phospho‐RTK array results demonstrate that P7C3 activates the phosphorylation state of multiple RTKs in hBMSCs. A] Phospho‐RTK array analysis of hBMSC cell lysates. hBMSCs were either treated with 10 µM DMSO or 10 µM P7C3 for 10 min. Cells were harvested for Phospho‐RTK array analysis. B,C] Quantification of Phospho‐RTK array is visualized via a heat map.
Figure 4
Figure 4
P7C3 attenuates osteoclastic maturation and activity in vitro. A] Representative confocal micrographs of human osteoclast precursors cultured with either DMSO or P7C3 over a 6‐day period. Prior to examination via confocal laser scanning microscopy, the cells were subjected to dual staining with fluorescein diacetate (live cells in green) and propidium iodide (dead cells in red). B] Quantitative analysis of mature osteoclast numbers using data derived from live/dead staining. ****p < 0.0001. C] Representative confocal microscopy images showing human osteoclast precursors cultured with either DMSO or P7C3 over a 6‐day period. Following fixation, the cells were stained with phalloidin (red) and DAPI (blue). D] Quantitative analysis of osteoclast numbers using data derived from phalloidin and DAPI staining. ****p < 0.0001. E] Representative images of TRAP staining showing multinucleated active osteoclasts (red). F] The number of osteoclasts were further quantitated via TRAP staining. ****p < 0.0001. G] The top 20 differentially expressed proteins (upregulated) following P7C3 treatment are presented. H] The top 20 differentially expressed proteins (downregulated) following P7C3 treatment are presented. I–K] GO enrichment analysis for differentially expressed biomarkers. BP = biological process I]; CC = cellular component J]; MF = molecular function K].
Figure 5
Figure 5
P7C3 (20 mg k−1g, given i.p.) administration maintains healthy levels of biomechanical bone strength and reduces bone loss, osteoclastogenesis, and activated osteoclastic activity in an OVX‐induced osteoporotic animal model. A] A flow chart of the animal experiment. B] The biomechanical properties of fracture load, fracture stress, yield load, yield stress, ultimate load, and ultimate stress at the tibial mid‐point during 3‐point bending analyses. Tibiae from OVX animals are biomechanically weaker, while animals receiving 20 mg k−1g i.p. treatment of P7C3 showed a significant increase in strength at 13 weeks post‐treatment. C] Representative H&E‐stained histology images of transverse sections through the femoral condyle. Images were acquired at ×2 (left panel) and ×10 (right panel) magnification, respectively. D] Tibiae and femora in each group were microCT scanned and 3D reconstructed images created using 3D Slicer. Representative images show trabecular bone loss in the OVX and DMSO‐vehicle groups, with an increased cancellous volume in animals treated with either Estradiol or P7C3. E] The TRAP activity of active osteoclasts was measured via TRAP staining. TRAP+ osteoclasts on the bone surface stained a purple‐red color and are indicated by red arrows. F] Immunohistochemical analysis of RANKL within trabecular bone in the distal femur. RANKL+ cells are shown by the red arrows. G] Quantification of trabecular interspaces. ****p < 0.0001. H] Quantification of TRAP+ osteoclasts per unit of bone surface (cells mm−2) via bone histomorphometric analyses (n = 6). I] Quantification of RANKL+ cells/bone surface (N mm−1). J] Serum levels of the bone resorption marker, CTX‐1 was analyzed using ELISA. P7C3 treatment significantly reduced the level of CTX‐1. *p < 0.05, **p < 0.01, ***p < 0.001, ****p < 0.0001.
Figure 6
Figure 6
P7C3 treatment (20 mg k−1g) attenuates adipogenesis in an OVX‐induced osteoporotic animal model. A] Representative in vivo imaging photograph showing changes in body mass, with OVX and vehicle‐treated rats exhibiting significant increases in body mass compared to the sham control. However, rats treated with Estradiol or P7C3 showed reduced whole‐body mass, as observed using the Bruker In‐Vivo Xtreme system. B] Cumulative change in body weight, indicating a significant reduction in body weight between animal groups following Estradiol and P7C3 treatment. Statistically significant differences in OVX versus Estradiol groups: Week 3, 7, 8, **p < 0.01; Week 9, ***p < 0.001.; Week 4, 5, 6, 10, 11, 12, 13, ****p < 0.0001. Statistically significant differences in OVX versus P7C3 groups: Week 3, 4, 5, 7, 8, 11, *p < 0.05; Week 2, 9, 10, **p < 0.01.; Week 6, 12, 13, ***p < 0.001. A heat map of total weight gain (g) over the study is also presented. Statistically significant differences in Sham versus OVX groups, OVX versus Estradiol groups, and OVX versus P7C3 groups were measured. C] Representative images of Sudan Black B staining showing the presence of black‐colored adipocytes (red arrow). The nuclei were counterstained with nuclear fast red (red). D] Quantification of Sudan Black B+ cell number in each group. E] Quantification of Sudan Black B+ cellular area, and F] cell diameter. G,H] Representative H&E‐stained sections of subcutaneous adipose tissue at 13 weeks post‐injection were analyzed. Results show the presence of multiple layers of adipocytes in the OVX and DMSO‐vehicle‐treated groups, while adipose tissue thickness was significantly reduced following treatment with Estradiol and P7C3, showing no difference compared to the sham group (****p < 0.0001). I,J] Representative images of Sudan Black B staining of subcutaneous adipose tissue at 13 weeks post‐injection. Results show similar results as the H&E staining, indicating that the adipocytes were greatly reduced following treatment with Estradiol and P7C3. *p < 0.05, **p < 0.01, ***p < 0.001, ****p < 0.0001.
Figure 7
Figure 7
Serum cytokine and chemokine profile following P7C3 treatment versus OVX animals. A] GO enrichment analysis for differentially expressed biomarkers. BP = biological process; CC = cellular component; MF = molecular function. B] The top 20 differentially expressed proteins (upregulated) following P7C3 treatment are presented. C] The top 14 differentially expressed proteins (downregulated) following P7C3 treatment are presented.
Figure 8
Figure 8
Serum cytokine and chemokine profiles in the Sham versus OVX, and OVX versus OVX + Estradiol groups. A] GO enrichment analysis for differentially expressed biomarkers in Sham versus OVX animals. BP = biological process; CC = cellular component; MF = molecular function. B] The top 8 differentially expressed proteins (upregulated) and, C] The top 4 differentially expressed proteins (downregulated) in Sham versus OVX rats. Similarly, D] GO enrichment analysis, E] the top 3 upregulated, and F] top 15 downregulated proteins in OVX versus OVX + Estradiol animals.
Figure 9
Figure 9
%Relative abundance of bacteria identified within the gut microbiome. A,B] in Sham versus OVX animals, C,D] Sham versus OVX + Estradiol animals, E,F] in Sham versus P7C3 animals. G] While no significant differences in the relative abundance of the major phyla (Firmicutes, Bacteriodetes, Actinobacteria, and unknown) was found between treatment groups, significant differences were observed among several less abundant phyla (Verruomicrobia, Proteobacteria, Tenericutes, Deferribacteres, Fusobacteria and Melainabacteria). Changes in the mean %relative abundance are presented. *p < 0.05.
Figure 10
Figure 10
%Relative abundance of bacteria identified within the gut microbiome. A,B] in Sham versus OVX + Vehicle animals, C,D] Sham versus OVX + Estradiol animals, E,F] in Sham versus OVX + P7C3 animals.
Figure 11
Figure 11
Schematic diagram showing the protective effect provided by exogenous administration of P7C3 against OVX‐induced osteoporosis. The process of aging, particularly in post‐menopausal women who experience estrogen deficiency, can lead to weaker bones that are more susceptible to fractures. This condition is characterized by a loss of bone mass, increased osteoclast activity, an accumulation of marrow adiposity, and adipogenic weight gain. Here, and to the best of our knowledge, we are first to discover that exogenous administration of 20 mg k−1g P7C3 can shift the pathological environment induced by osteoporosis from favoring osteoclastogenesis and adipogenesis into osteogenesis, thereby providing significant protection to bone against osteoporosis‐mediated bone loss and fracture in vivo. P7C3‐induced alterations within the gut microbiome may also contribute to the favorable result observed.

Similar articles

Cited by

References

    1. Sozen T., Ozisik L., Calik Basaran N., Eur. J. Rheumatol. 2017, 4, 46. - PMC - PubMed
    1. Leboff M. S., Greenspan S. L., Insogna K. L., Lewiecki E. M., Saag K. G., Singer A. J., Siris E. S., Osteoporos Int. 2022, 33, 2049. - PMC - PubMed
    1. Pisani P., Renna M. D., Casciaro F. E., Di Paola M., Quarta E., Muratore M., Casciaro S., World J. Orthop. 2016, 7, 171. - PMC - PubMed
    1. Weber T. J., J. Clin. Invest. 2016, 126, 829. - PMC - PubMed
    1. Shen Y., Huang X., Wu J., Lin X., Zhou X., Zhu Z., Pan X., Xu J., Qiao J., Zhang T., Ye L., Jiang H., Ren Y., Shan P.‐F., Front. Endocrinol. 2022, 13, 1990. - PMC - PubMed

LinkOut - more resources