. 2024 Apr 19;39(3):341-356.
doi: 10.1093/jbmr/zjae015.

Bub1 suppresses inflammatory arthritis-associated bone loss in mice through inhibition of TNFα-mediated osteoclastogenesis

Affiliations

Bub1 suppresses inflammatory arthritis-associated bone loss in mice through inhibition of TNFα-mediated osteoclastogenesis

Shuhei Yoshida et al. J Bone Miner Res. .

Abstract

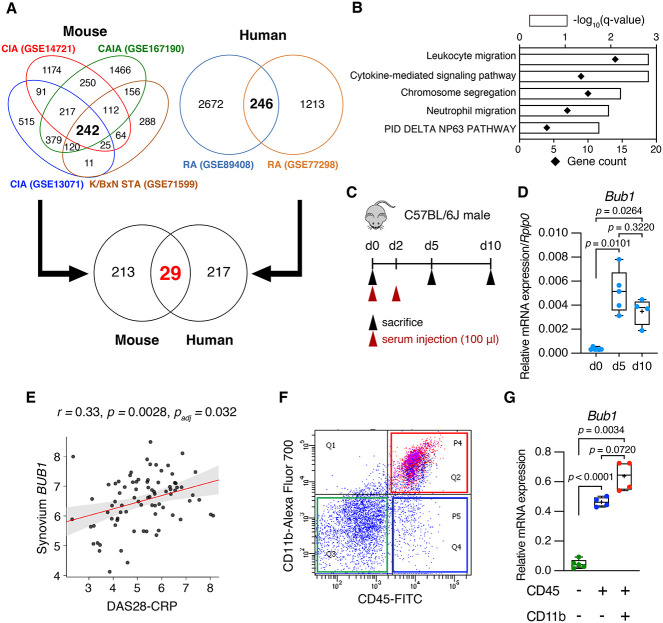
Rheumatoid arthritis (RA) is an inflammatory autoimmune disease characterized by synovitis, bone and cartilage destruction, and increased fracture risk with bone loss. Although disease-modifying antirheumatic drugs have dramatically improved clinical outcomes, these therapies are not universally effective in all patients because of the heterogeneity of RA pathogenesis. Therefore, it is necessary to elucidate the molecular mechanisms underlying RA pathogenesis, including associated bone loss, in order to identify novel therapeutic targets. In this study, we found that Budding uninhibited by benzimidazoles 1 (BUB1) was highly expressed in RA patients' synovium and murine ankle tissue with arthritis. As CD45+CD11b+ myeloid cells are a Bub1 highly expressing population among synovial cells in mice, myeloid cell-specific Bub1 conditional knockout (Bub1ΔLysM) mice were generated. Bub1ΔLysM mice exhibited reduced femoral bone mineral density when compared with control (Ctrl) mice under K/BxN serum-transfer arthritis, with no significant differences in joint inflammation or bone erosion based on a semi-quantitative erosion score and histological analysis. Bone histomorphometry revealed that femoral bone mass of Bub1ΔLysM under arthritis was reduced by increased osteoclastic bone resorption. RNA-seq and subsequent Gene Set Enrichment Analysis demonstrated a significantly enriched nuclear factor-kappa B pathway among upregulated genes in receptor activator of nuclear factor kappa B ligand (RANKL)-stimulated bone marrow-derived macrophages (BMMs) obtained from Bub1ΔLysM mice. Indeed, osteoclastogenesis using BMMs derived from Bub1ΔLysM was enhanced by RANKL and tumor necrosis factor-α or RANKL and IL-1β treatment compared with Ctrl. Finally, osteoclastogenesis was increased by Bub1 inhibitor BAY1816032 treatment in BMMs derived from wildtype mice. These data suggest that Bub1 expressed in macrophages plays a protective role against inflammatory arthritis-associated bone loss through inhibition of inflammation-mediated osteoclastogenesis.

Keywords: Bub1; NF-κB; bone metabolism; osteoclasts; rheumatoid arthritis.

Plain language summary

Rheumatoid arthritis (RA) is a disease caused by an abnormal immune system, resulting in inflammation, swelling, and bone destruction in the joints, along with systemic bone loss. While new medications have dramatically improved treatment efficacy, these therapies are not universally effective for all patients. Therefore, we need to understand the regulatory mechanisms behind RA, including associated bone loss, to develop better therapies. In this study, we found that Budding uninhibited by benzimidazoles 1 (Bub1) was highly expressed in inflamed joints, especially in myeloid cells, which are a type of immune cells. To explore its role, we created myeloid cell–specific Bub1 conditional knockout (cKO) mice and induced arthritis to analyze its role during arthritis. The cKO mice exhibited lower bone mineral density when compared with control mice under inflammatory arthritis because of increased osteoclastic bone resorption, without significant differences in joint inflammation or bone erosion. Further investigation showed that Bub1 prevents excessive osteoclast differentiation induced by inflammation in bone marrow macrophages. These data suggest that Bub1 in macrophages protects against bone loss caused by inflammatory arthritis, offering potential insights for developing treatments that focus on bone health.


Conflict of interest statement

None declared.

Figures

Graphical Abstract
Graphical Abstract
Figure 1
Figure 1
Bub1 expression was upregulated in human RA and the murine arthritis model. (A) Venn diagram showing the number of upregulated genes in the murine arthritis models and in human RA. GSE14721: Articular tissue from CIA (vs. adjuvant ctrl); GSE13071: Knee joint synovium from CIA (vs. naïve ctrl); GSE167190: Whole ankle tissue from CAIA (vs. LPS ctrl); GSE71599: K/BxN STA synovium (vs. PBS ctrl); GSE89408: RA synovial biopsies (vs. Osteoarthritis); GSE77298: RA synovial biopsies (vs. healthy ctrl). (B) Gene ontology and pathway enrichment analysis of 29 upregulated genes in (A) by Metascape. (C) Schematic of the time schedule to induce K/BxN STA. In all, 100 μl K/BxN serum was injected twice (i.p.). (D) The expression level of Bub1 gene categorized as “chromosome segregation” was verified using the K/BxN STA model (d0: n = 6, d5: n = 5, d10: n = 4). Whole ankle tissue was collected and analyzed by RT-qPCR. (E) The PEAC study showed a significant correlation between DAS (DAS28-CRP) and BUB1 expression in synovium. (F, G) Synovial tissue was obtained from K/BxN mice and digested by type IV collagenase. Each cell population was isolated by flow cytometry. Bub1 expression in isolated cells was analyzed by RT-qPCR (CD45-CD11b-: n = 5, CD45+CD11b-: n = 4, CD45+CD11b+: n = 4). Statistical significance was determined by Brown–Forsythe and Welch ANOVA tests followed by post hoc Dunnett’s T3 multiple comparisons tests. Symbols represent individual mice.
Figure 2
Figure 2
Bub1ΔLysM showed no difference in arthritis severity under K/BxN STA. (A) Schematic illustration showing the breeding strategy to generate myeloid cell–specific Bub1 cKO mice. (B) BMMs were collected from tibiae and KO efficiency was analyzed in BMMs by RT-qPCR (Ctrl: n = 6, Bub1ΔLysM: n = 7). (C) Cell proliferation of Ctrl (n = 13) and Bub1ΔLysM (n = 8) derived BMMs was determined by MTT assay. (D) Schematic of the time schedule to induce K/BxN STA. Overall, 100 μl K/BxN serum was injected at day 0 (i.p.). (E) Evaluation of clinical score and hind paw thickening of Ctrl (n = 11) and Bub1ΔLysM (n = 9) male mice after K/BxN STA induction. (F) Representative 3D reconstructions of the ankle joints of mice induced with K/BxN STA (d10). Scale bars: 100 μm. (G) Semiquantitative analysis of bone erosion score (Ctrl: n = 7, Bub1ΔLysM: n = 8). The scoring method is shown in Materials and Methods. (H) Representative images of histological sections of the ankle obtained from Ctrl and Bub1ΔLysM male mice induced with K/BxN STA (d10). The sections were stained to show TRAP activity and bone tissue was counterstained by fast green. Scale bars: 500 μm. (I) Quantitative bone histomorphometric analysis of the tibiae and calcaneus bone derived from Ctrl (n = 8) and Bub1ΔLysM (n = 9) mice induced with K/BxN STA. Oc.S/Cortical BS and N.Oc/Cortical B.Pm were scored and statistically compared. Statistical significance was determined by two–tailed Welch’s t-tests. Data shown as mean ± SD or box plots for each group. Symbols represent individual mice.
Figure 3
Figure 3
Trabecular bone mass was decreased in Bub1ΔLysM under K/BxN STA. (A) The body weight of male (Left: Ctrl: n = 11, Bub1ΔLysM: n = 9) and female (Right: Ctrl: n = 9, Bub1ΔLysM: n = 8) after K/BxN STA (d10). (B) Femoral BMD of Ctrl and Bub1ΔLysM mice induced with K/BxN STA (d10) was analyzed by DXA (Left: male, Ctrl: n = 11, Bub1ΔLysM: n = 9, Right: female, Ctrl: n = 9, Bub1ΔLysM: n = 8). (C) Femoral BMD distribution in male (Ctrl: n = 11, Bub1ΔLysM: n = 9). (D) Representative 3D reconstructions of trabecular bone of male mice induced with K/BxN STA (d10). Scale bars: 100 μm. (E) Quantification of trabecular and cortical bone in male mice was performed using μCT (Ctrl: n = 11, Bub1ΔLysM: n = 9). (F) Representative images of histological sections of the distal femurs obtained from Ctrl and Bub1ΔLysM male mice induced with K/BxN STA (d10). The sections were stained to show TRAP activity. Scale bars: 50 μm. (G) Quantitative bone histomorphometric analysis of the trabecular bone in the distal femurs derived from Ctrl (n = 8) and Bub1ΔLysM (n = 8) male mice induced with K/BxN STA. Oc.S/BS and N.Oc/B.Pm were scored and statistically compared. (H) Representative images of toluidine blue staining. Scale bars: 50 μm. (I) Quantitative bone histomorphometric analysis. Ob.S/BS and N.Ob/B.Pm were scored and statistically compared (Ctrl: n = 8, Bub1ΔLysM: n = 8). Statistical significance was determined by two–tailed Welch’s t-tests. Data shown as mean ± SD or box plots for each group. Symbols represent individual mice.
Figure 4
Figure 4
NF-κB pathway was enhanced in Bub1ΔLysM–derived BMMs. (A) Schematic illustrating the induction of osteoclast differentiation. (B) Representative images of TRAP staining of BMMs. In all, 150–ng/mL RANKL was treated. Scale bars: 200 μm. (C) The number of multinucleated TRAP+ cells (Nuclei ≥ 5) (Ctrl: n = 3, Bub1ΔLysM: n = 3). (D) Expression of osteoclast differentiation marker genes were analyzed by RT-qPCR. In all, 50–ng/mL RANKL was treated (Ctrl: n = 3, Bub1ΔLysM: n = 3). (E) PCA of gene expression profiles obtained by RNA-seq analysis (Ctrl: n = 3, Bub1ΔLysM: n = 3). (F) Heatmap of expression values normalized as transcripts per million (TPM) in DEGs of Ctrl and Bub1ΔLysM–derived BMMs on day 2 after RANKL (50 ng/mL) treatment. (G) Volcano plot showing log2 fold change (log2 FC) and statistical significance (Padj value) of differences between Ctrl and Bub1ΔLysM BMMs. Padj value cutoff was set to 0.05. (H) Significantly enriched pathways among upregulated genes by GSEA. Statistical significance was determined by two–tailed Welch’s t-tests (C) or two–way ANOVA tests followed by post hoc Šídák’s multiple comparison tests (D). Data represent means ± SD for each group. Symbols represent individual mice.
Figure 5
Figure 5
BMMs derived from Bub1ΔLysM mice are sensitive to TNFα stimulation. (A) Schematic illustrating the induction of osteoclast differentiation. (B) Representative images of TRAP staining of BMMs. Scale bars: 200 μm. (C) The number of multinucleated TRAP+ cells (Nuclei ≥ 5) (Ctrl: n = 6, Bub1ΔLysM: n = 6). (D) The number of multinucleated TRAP+ cells in each nuclei number group (Ctrl: n = 6, Bub1ΔLysM: n = 6). (E) Expression levels of osteoclast differentiation marker genes were analyzed by RT-qPCR (Ctrl: n = 3, Bub1ΔLysM: n = 3). (F) Expression level of Bub1 in Ctrl and Bub1ΔLysM BMMs with or without TNFα was analyzed by RT-qPCR (d4, Ctrl: n = 3, Bub1ΔLysM: n = 3). (G, H) BMMs were treated with RANKL and TNFα for 30 min and phosphorylation of IκBα (Ser32) was analyzed by western blot (Ctrl: n = 8, Bub1ΔLysM: n = 8). (I) Immunostaining of BMMs after 3 h of RANKL and TNFα treatment. Scale bars: 50 μm. (J) The ratio of nuclear localizing p65+ cells (Ctrl: n = 6, Bub1ΔLysM: n = 6). Statistical significance was determined by two–tailed Welch’s t-tests (C, E, H, J) or by two–way ANOVA tests followed by post hoc Šídák’s multiple comparison tests (D, F). Data represent means ± SD for each group. Symbols represent individual mice.
Figure 6
Figure 6
Bub1 inhibitor BAY1816032 promotes osteoclastogenesis in vitro. (A) Schematic illustrating the induction of osteoclast differentiation with the treatment of Bub1 inhibitor BAY1816032. (B) Representative images of TRAP staining of BMMs derived from wild–type mice at different concentrations of BAY1816032 (BAY). Scale bars: 200 μm. (C) Number of multinucleated TRAP+ cells (Nuclei ≥ 5) at different concentrations of BAY (n = 3). Statistical significance was determined by Brown–Forsythe and Welch ANOVA tests followed by post hoc Dunnett’s T3 multiple comparisons tests. Data represent means ± SD for each group. Symbols represent individual mice.

Similar articles

Cited by

References

    1. McInnes IB, Schett G. The pathogenesis of rheumatoid arthritis. N Engl J Med. 2011;55(12):2255–2270. - PubMed
    1. Haugeberg G, Uhlig T, Falch JA, Halse JI, Kvien TK. Bone mineral density and frequency of osteoporosis in female patients with rheumatoid arthritis: results from 394 patients in the Oslo County rheumatoid arthritis register. Arthritis Rheum. 2000;43(3):522–530. 10.1002/1529-0131(200003)43:3<522::AID-ANR7>3.0.CO;2-Y. - DOI - PubMed
    1. Wright NC, Lisse JR, Walitt BT, Eaton CB, Chen Z, Women's Health Initiative Investigators . Arthritis increases the risk for fractures — results from the women’s health initiative. J Rheumatol. 2011;38(8):1680–1688. 10.3899/jrheum.101196. - DOI - PMC - PubMed
    1. Schett G, Gravallese E. Bone erosion in rheumatoid arthritis: mechanisms, diagnosis and treatment. Nat Rev Rheumatol. 2012;8(11):656–664. 10.1038/nrrheum.2012.153. - DOI - PMC - PubMed
    1. Yamanaka H, Tanaka E, Nakajima A, et al. . A large observational cohort study of rheumatoid arthritis, IORRA: providing context for today’s treatment options. Mod Rheumatol. 2020;30(1):1–6. 10.1080/14397595.2019.1660028. - DOI - PubMed