. 2024 May 2;39(4):484-497.
doi: 10.1093/jbmr/zjae023.

Temporal patterns of osteoclast formation and activity following withdrawal of RANKL inhibition

Affiliations

Temporal patterns of osteoclast formation and activity following withdrawal of RANKL inhibition

Albert S Kim et al. J Bone Miner Res. .

Abstract

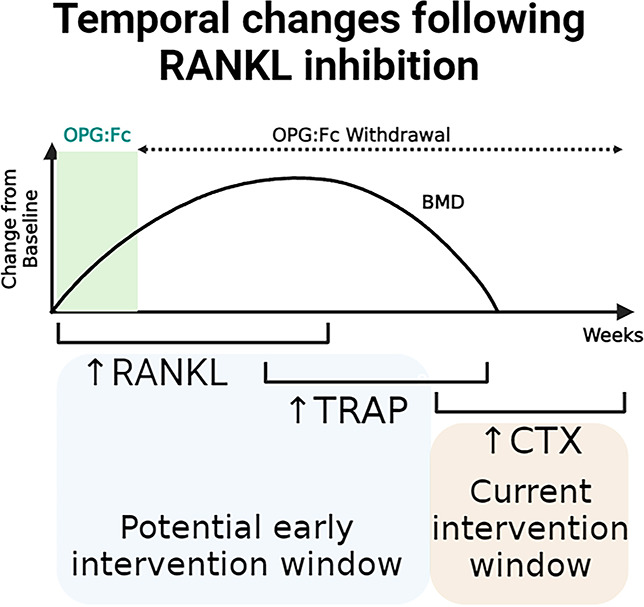
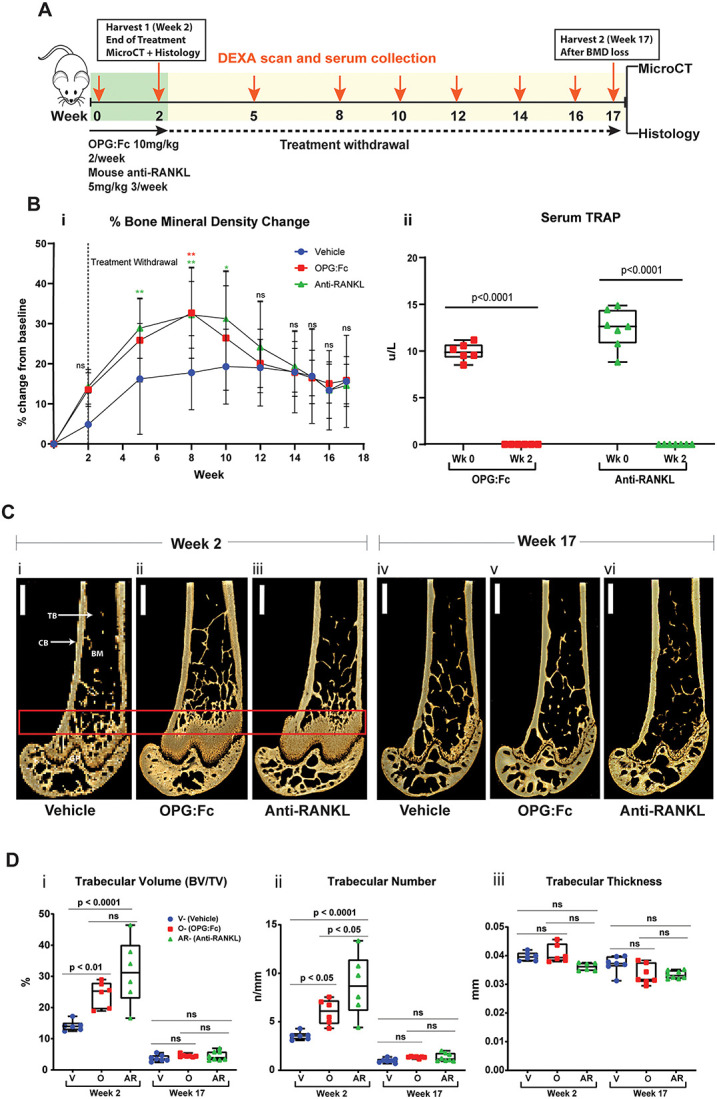
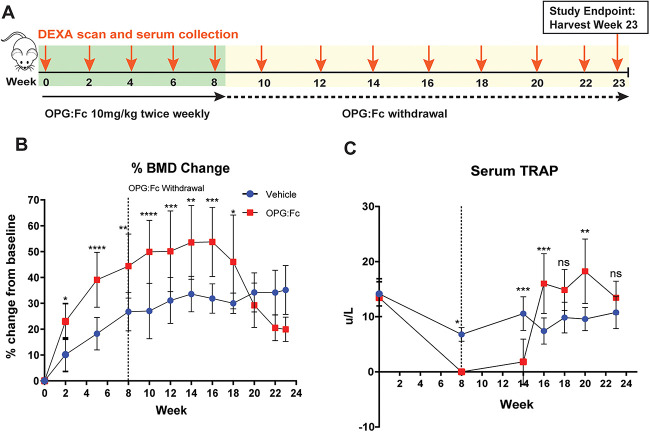
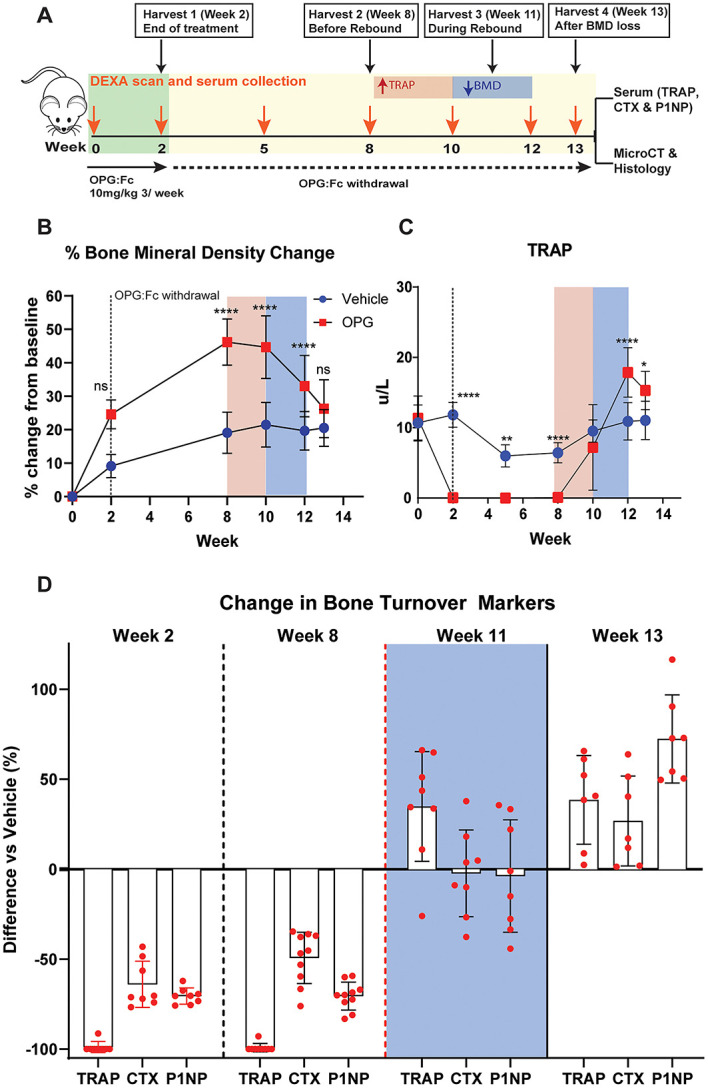
Rebound bone loss following denosumab discontinuation is an important clinical challenge. Current treatment strategies to prevent this fail to suppress the rise and overshoot in osteoclast-mediated bone resorption. In this study, we use a murine model of denosumab treatment and discontinuation to show the temporal changes in osteoclast formation and activity during RANKL inhibition and withdrawal. We show that the cellular processes that drive the formation of osteoclasts and subsequent bone resorption following withdrawal of RANKL inhibition precede the rebound bone loss. Furthermore, a rise in serum TRAP and RANKL levels is detected before markers of bone turnover used in current clinical practice. These mechanistic advances may provide insight into a more defined window of opportunity to intervene with sequential therapy following denosumab discontinuation.

Keywords: Denosumab; RANKL; osteoclast; osteoporosis.

Plain language summary

Stopping denosumab, a medication commonly used to improve bone mass by blocking formation of bone resorbing osteoclasts, leads to a rebound loss in the bone which was gained during treatment. Current strategies to prevent this bone loss fail in most cases as they are unable to prevent the rise and overshoot in bone resorption by osteoclasts. Thie stems from an incomplete understanding of how osteoclasts behave during denosumab treatment and after treatment is discontinued. We use a mouse model of this phenomenon to show how osteoclast formation and activity changes throughout this process. We show that increases in the processes that drive the formation of osteoclasts can be detected in the circulation before bone loss occurs. These findings could therefore provide insight into a targeted ‘window of opportunity’ to intervene and prevent the rebound bone loss following stopping denosumab in patients.


Conflict of interest statement

None declared.

Figures

Graphical Abstract
Graphical Abstract
Figure 1
Figure 1
RANKL inhibition with OPG:Fc increases BMD, and treatment withdrawal leads to loss of bone mass and density. (A) Schematic of the experimental design to assess the effect of treatment with OPG:Fc or murine anti-RANKL antibody. (B) BMD and TRAP changes following treatment. (i) BMD shown as a percentage change from baseline levels following treatment with OPG:Fc (n = 9), murine anti-RANKL antibody (n = 9), or saline (vehicle, n = 9). Dotted line showing the end of treatment at week 2. Data represented as mean ± SD. Asterisks indicate P-values < .05 (*P < .05, **P < .01). (ii) Serum TRAP measured by ELISA at baseline and following 2 wk of treatment with OPG:Fc (n = 6) or murine anti-RANKL antibody (n = 7). Boxplots represent mean ± SD. (C) Representative 3D microCT reconstructed images of the right femur at the end of 2 wk of treatment (i)-(iii) and at the end of the study (iv)-(vi). Box highlighting the region of interest. CB, cortical bone; TB, trabecular bone; BM, bone marrow. (D) MicroCT analysis of the region of interest showing trabecular volume (i), number (ii), and thickness (iii) at the end of treatment (week 2, n = 6-7 per group) and at the end of the study (week 17, n = 9 per group). Boxplots represent mean ± SD. V, vehicle; O, OPG:Fc; AR, anti-RANKL.
Figure 2
Figure 2
Longer duration of RANKL inhibition increases the rate of BMD loss and leads to sustained increases in serum TRAP following treatment withdrawal. (A) Schematic of the experimental design to assess the effect of longer duration of treatment with OPG:Fc on BMD and serum TRAP. N = 10 per group. (B) Longitudinal change in BMD presented as percentage change from baseline. Dotted line showing end of treatment at week 8. Data presented as mean ± SD. Asterisks indicate P-values < .05 (*P < .05, **P < .01, ***P < .001, ****P < .0001). (C) Longitudinal serum TRAP throughout the study. Dotted line showing end of treatment at week 8. Data presented as mean ± SD. Asterisks indicate P-values < .05 (**P < .01, ***P < .001).
Figure 3
Figure 3
Serum TRAP rises above vehicle levels before P1NP and CTX following withdrawal of RANKL inhibition. (A) Schematic of the study design to harvest cohorts of mice at specific intervals following 2 wk of OPG:Fc treatment to allow for contemporaneous measurements of bone turnover markers, changes in bone microarchitecture, and histology. Pink box (left) highlights a time at which serum TRAP is rising from post treatment levels, while the blue box (right) highlights the time during which BMD loss is occurring. (B) Longitudinal changes in BMD. Data presented as mean ± SD. Asterisks indicate P-values < .05 (*P < .05, **P < .01, ***P < .001, ****P < .0001). (C) Longitudinal changes in serum TRAP. Data presented as mean ± SD. Asterisks indicate P-values < .05 (*P < .05, **P < .01, ***P < .001, ****P < .0001). (D) Changes in the bone turnover markers (TRAP, CTX, and P1NP) in mice treated with OPG:Fc compared to vehicle at each harvest timepoint, expressed as % change compared to vehicle mean. Week 11 highlighted in the blue box represents the time during which BMD loss is occurring.
Figure 4
Figure 4
Changes in bone microarchitecture during rebound bone loss following withdrawal of RANKL inhibition with OPG:Fc. (A) Representative 3D images of harvested femora showing differences in bone microarchitecture between mice treated with saline and OPG:Fc. Dashed red box denotes a region of interest examined at a 0.5 mm section located 3 mm above the growth plate (GP). Solid red box denotes region of interest examined at a 1 mm section located 2 mm above the growth plate. CB, cortical bone; TB, trabecular bone. (B) Differences in trabecular volume (i), number (ii), and thickness (iii) between mice treated with saline (vehicle) and OPG:Fc at the harvest timepoints. Boxplots represent mean ± SD. (C) Differences in cortical volume (i) and thickness (ii) between mice treated with saline (vehicle) and OPG:Fc at the harvest timepoints. Boxplots represent mean ± SD.
Figure 5
Figure 5
Changes in osteoclast number and activity during rebound bone loss following withdrawal of RANKL inhibition with OPG:Fc. (A) Representative histological images of femora stained with TRAP (red) harvested following treatment with saline or OPG:Fc. Analysis of osteoclast parameters on trabecular bone was performed within the ROI defined by the dotted line (scale bar 900 μm at 2.2× magnification). Representative high magnification images shown in top left corner and its corresponding ROI shown in the black box (scale bar 300 μm at 9.8× magnification). Red box (near bottom of image) denotes osteoclasts observed on trabecular bone surfaces as shown in magnified images in Figure 5E. (B) Quantification of number of osteoclasts (i) and osteoclast surface (ii) per trabecular bone surfaces at harvest timepoints week 2, 8, 11, and 13. Boxplots represent mean ± SD. (C) Quantification of serum RANKL following OPG:Fc treatment. Boxplots represent mean ± SD. (D) Quantification of mRNA expression of (i) Rankl, (ii) Opg, and (iii) Rankl:Opg in marrow depleted femora of mice treated with saline or OPG:Fc harvested at week 8. Boxplots represent mean ± SD. Representative images of osteoclasts observed on trabecular bone surfaces throughout the study in the ROI marked by the red box in Figure 5A (scale bar 300 μm at 7× magnification).

Similar articles

Cited by

References

    1. Boyce BF, Xing L. The RANKL/RANK/OPG pathway. Curr Osteoporos Rep. 2007;5(3):98–104. 10.1007/s11914-007-0024-y. - DOI - PubMed
    1. Bone HG, Wagman RB, Brandi ML, et al. 10 years of denosumab treatment in postmenopausal women with osteoporosis: results from the phase 3 randomised FREEDOM trial and open-label extension. Lancet Diabetes Endocrinol. 2017;5(7):513–523. 10.1016/S2213-8587(17)30138-9. - DOI - PubMed
    1. Bone HG, Bolognese MA, Yuen CK, et al. Effects of denosumab treatment and discontinuation on bone mineral density and bone turnover markers in postmenopausal women with low bone mass. J Clin Endocrinol Metab. 2011;96(4):972–980. 10.1210/jc.2010-1502. - DOI - PubMed
    1. Sølling AS, Harsløf T, Langdahl B. Treatment with Zoledronate Subsequent to Denosumab in Osteoporosis: a Randomized Trial. J Bone Miner Res. 2020;35(10):1858–1870. 10.1002/jbmr.4098. - DOI - PubMed
    1. Anastasilakis AD, Papapoulos SE, Polyzos SA, Appelman-Dijkstra NM, Makras P. Zoledronate for the prevention of bone loss in women discontinuing denosumab treatment. a prospective 2-year clinical trial. J Bone Miner Res. 2019;34(12):2220–2228. 10.1002/jbmr.3853. - DOI - PubMed

Publication types