. 2024 Dec;602(23):6531-6552.
doi: 10.1113/JP285553. Epub 2024 Mar 13.

Circadian patterns of behaviour change during pregnancy in mice

Affiliations

Circadian patterns of behaviour change during pregnancy in mice

Georgia S Clarke et al. J Physiol. 2024 Dec.

Abstract

Food intake and activity adapt during pregnancy to meet the increased energy demands. In comparison to non-pregnant females, pregnant mice consume more food, eating larger meals during the light phase, and reduce physical activity. How pregnancy changes the circadian timing of behaviour was less clear. We therefore randomised female C57BL/6J mice to mating for study until early (n = 10), mid- (n = 10) or late pregnancy (n = 11) or as age-matched, non-pregnant controls (n = 12). Mice were housed individually in Promethion cages with a 12 h light-12 h dark cycle [lights on at 07.00 h, Zeitgeber (ZT)0] for behavioural analysis. Food intake between ZT10 and ZT11 was greater in pregnant than non-pregnant mice on days 6.5-12.5 and 12.5-17.5. In mice that exhibited a peak in the last 4 h of the light phase (ZT8-ZT12), peaks were delayed by 1.6 h in the pregnant compared with the non-pregnant group. Food intake immediately after dark-phase onset (ZT13-ZT14) was greater in the pregnant than non-pregnant group during days 12.5-17.5. Water intake patterns corresponded to food intake. From days 0.5-6.5 onwards, the pregnant group moved less during the dark phase, with decreased probability of being awake, in comparison to the non-pregnant group. The onset of dark-phase activity, peaks in activity, and wakefulness were all delayed during pregnancy. In conclusion, increased food intake during pregnancy reflects increased amplitude of eating behaviour, without longer duration. Decreases in activity also contribute to positive energy balance in pregnancy, with delays to all measured behaviours evident from mid-pregnancy onwards. KEY POINTS: Circadian rhythms synchronise daily behaviours including eating, drinking and sleep, but how these change in pregnancy is unclear. Food intake increased, with delays in peaks of food intake behaviour late in the light phase from days 6.5 to 12.5 of pregnancy, in comparison to the non-pregnant group. The onset of activity after lights off (dark phase) was delayed in pregnant compared with non-pregnant mice. Activity decreased by ∼70% in the pregnant group, particularly in the dark (active) phase, with delays in peaks of wakefulness evident from days 0.5-6.5 of pregnancy onwards. These behavioural changes contribute to positive energy balance during pregnancy. Delays in circadian behaviours during mouse pregnancy were time period and pregnancy stage specific, implying different regulatory mechanisms.

Keywords: circadian; food intake; physical activity; pregnancy.


Conflict of interest statement

The authors declare no conflicts of interest.

Figures

Figure 1
Figure 1. Food intake pattern of non‐pregnant and pregnant mice
Food consumption (A–C) is the mean (SD) of raw data for each mouse, averaged across each study block (day 0.5–6.5, 6.5–12.5 and 12.5–17.5), within non‐pregnant (blue line, n ≥ 6) and pregnant (red line, n ≥ 11) groups. The light phase (ZT6–ZT12 and ZT24–ZT6, no shading) and dark phase (ZT12–ZT24, shaded) are shown for day 0.5–6.5 (A), day 6.5–12.5 (B) and day 12.5–17.5 (C). The fitted model of food consumption (D–F) across each of the three blocks of the study indicates fitted means (continuous lines) and 95% credible intervals (dashed lines) for all non‐pregnant (blue) and pregnant (red) groups. The light phase (ZT6–ZT12 and ZT24–ZT6, no shading) and dark phase (ZT12–ZT24, shaded) are shown for day 0.5–6.5 (D), day 6.5–12.5 (E) and day 12.5–17.5 (F).
Figure 2
Figure 2. Water intake pattern of non‐pregnant and pregnant mice
Water consumption (A–C) is the mean (SD) of raw data for each mouse, averaged across each study block (day 0.5–6.5, 6.5–12.5 and 12.5–17.5), within non‐pregnant (blue line, n ≥ 6) and pregnant (red line, n ≥ 11) groups. The light phase (ZT6–ZT12 and ZT24–ZT6, no shading) and dark phase (ZT12–ZT24, shaded) are shown for day 0.5–6.5 (A), day 6.5–12.5 (B) and day 12.5–17.5 (C). The fitted model of water consumption (D–F) across each of the three blocks of the study indicates fitted means (continuous lines) and 95% credible intervals (dashed lines) for all non‐pregnant (blue) and pregnant (red) groups. The light phase (ZT6–ZT12 and ZT24–ZT6, no shading) and dark phase (ZT12–ZT24, shaded) are shown for day 0.5–6.5 (D), day 6.5–12.5 (E) and day 12.5–17.5 (F).
Figure 3
Figure 3. The impact of pregnancy on the time of first activity onset during the dark phase
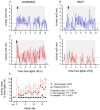
Daily activity onset in the dark phase was defined as the time at which the mouse first achieved three consecutive 5 min periods of movement greater than its the average night‐time activity during the acclimation period. Representative plots of cage activity recorded every 5 min are shown for acclimation (A and C) and study day 8 (B and D) for a representative non‐pregnant (A and B) and pregnant (C and D) mouse during the dark phase (shaded area). The dotted line indicates the acclimation average dark‐phase activity for the individual mouse, and the downwards arrow shows the time at which the mouse met the criterion for activity onset. The pregnant mouse on day 8 (D) did not reach the criterion for activity onset. Average timing of dark‐phase activity onset in non‐pregnant (blue symbols and line, n ≥ 5) and pregnant (red symbols and line, n ≥ 11) mice is presented as the mean (SD) for the acclimation period and for each study day (E). *P < 0.05, *P < 0.01 v. non‐prengnant mice.
Figure 4
Figure 4. Activity pattern of non‐pregnant and pregnant mice
Activity (A–C) is the mean (SD) of raw data for each mouse, averaged across each study block (day 0.5–6.5, 6.5–12.5 and 12.5–17.5), within non‐pregnant (blue line, n ≥ 6) and pregnant (red line, n ≥ 11) groups. The light phase (ZT6–ZT12 and ZT24–ZT6, no shading) and dark phase (ZT12–ZT24, shaded) are shown for day 0.5–6.5 (A), day 6.5–12.5 (B) and day 12.5–17.5 (C). The fitted model of activity (DF) across each of the three blocks of the study indicates fitted means (continuous lines) and 95% credible intervals (dashed lines) for all non‐pregnant (blue) and pregnant (red) groups. The light phase (ZT6–ZT12 and ZT24–ZT6, no shading) and dark phase (ZT12–ZT24, shaded) are shown for day 0.5–6.5 (D), day 6.5–12.5 (E) and day 12.5–17.5 (F).
Figure 5
Figure 5. Sleep–wake behaviour of non‐pregnant and pregnant mice
Time spent awake (AC) is the mean (SD) of raw data for each mouse, averaged across each study block (day 0.5–6.5, 6.5–12.5 and 12.5–17.5), within non‐pregnant (blue line, n ≥ 6) and pregnant (red line, n ≥ 11) groups. The light phase (ZT6–ZT12 and ZT24–ZT6, no shading) and dark phase (ZT12–ZT24, shaded) are shown for day 0.5–6.5 (A), day 6.5–12.5 (B) and day 12.5–17.5 (C). The fitted model of sleep probability (D–F) across each of the three blocks of the study indicates fitted means (continuous lines) and 95% credible intervals (dashed lines) for all non‐pregnant (blue) and pregnant (red) groups. The light phase (ZT6–ZT12 and ZT24–ZT6, no shading) and dark phase (ZT12–ZT24, shaded) are shown for day 0.5–6.5 (D), day 6.5–12.5 (E) and day 12.5–17.5 (F).

References

    1. Albers, E. E. , Gerall, A. A. , & Axelson, J. F. (1981). Effect of reproductive state on circadian periodicity in the rat. Physiology & Behavior, 26(1), 21–25. - PubMed
    1. Bains, R. S. , Wells, S. , Sillito, R. R. , Armstrong, J. D. , Cater, H. L. , Banks, G. , & Nolan, P. M. (2018). Assessing mouse behaviour throughout the light/dark cycle using automated in‐cage analysis tools. Journal of Neuroscience Methods, 300, 37–47. - PMC - PubMed
    1. Brooks, M. E. , Kristensen, K. , Benthem, K. J. V. , Magnusson, A. , Berg, C. W. , Nielsen, A. , Skaug, H. J. , Mächler, M. , & Bolker, B. M. (2017). glmmTMB balances speed and flexibility among packages for zero‐inflated generalized linear mixed modeling. R Journal, 9(2), 378–400.
    1. Bürkner, P.‐C. (2017). Brms : An R package for bayesian multilevel models using stan. Journal of Statistical Software, 80(1), 1–28.
    1. Cai, C. , Vandermeer, B. , Khurana, R. , Nerenberg, K. , Featherstone, R. , Sebastianski, M. , & Davenport, M. H. (2019). The impact of occupational shift work and working hours during pregnancy on health outcomes: A systematic review and meta‐analysis. American Journal of Obstetrics and Gynecology, 221(6), 563–576. - PubMed

LinkOut - more resources