

Review
doi: 10.1021/acs.chemrev.3c00581.
Epub 2024 Mar 13.
Carbon Nanomaterial Fluorescent Probes and Their Biological Applications
Affiliations
- PMID: 38478064
- PMCID: PMC10979413
- DOI: 10.1021/acs.chemrev.3c00581
Item in Clipboard
Review
Carbon Nanomaterial Fluorescent Probes and Their Biological Applications
Chem Rev.
.
Abstract
Fluorescent carbon nanomaterials have broadly useful chemical and photophysical attributes that are conducive to applications in biology. In this review, we focus on materials whose photophysics allow for the use of these materials in biomedical and environmental applications, with emphasis on imaging, biosensing, and cargo delivery. The review focuses primarily on graphitic carbon nanomaterials including graphene and its derivatives, carbon nanotubes, as well as carbon dots and carbon nanohoops. Recent advances in and future prospects of these fields are discussed at depth, and where appropriate, references to reviews pertaining to older literature are provided.
Conflict of interest statement
The authors declare no competing financial interest.
Figures
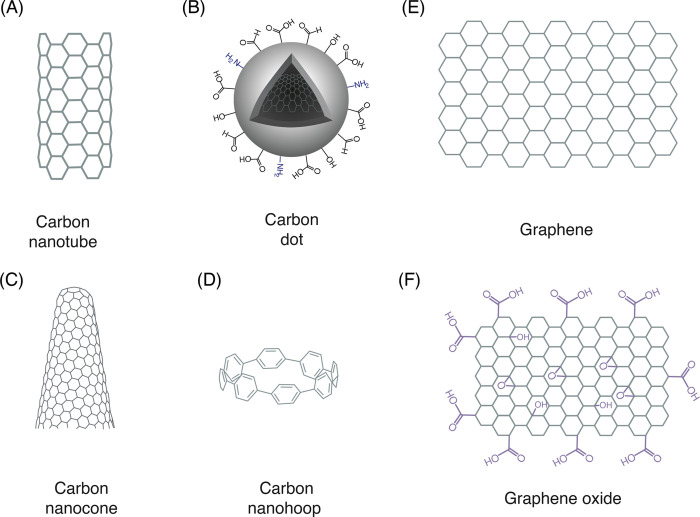
Carbon nanomaterial (CNM) types and their
structures. (A) Pristine
carbon nanotubes are cylindrical nanocrystals of sp2 hybridized
carbon atoms. (B) Carbon dots are quasi-spherical nanoparticles with
a mix of sp2 and sp3 carbon atoms and contain
a variety of functional handles. (C) Carbon nanocones represent sp2 carbon atoms rolled into a conical geometry. (D) Carbon nanohoops
can be conceptualized as a single slice of a carbon nanotube. (E,
F) Pristine graphene is a 2-dimensional material made of sp2 carbon atoms in a honeycomb-like arrangement, whereas graphene oxide
contains a mix of sp2 and sp3 carbon atoms and
features various functional moieties.
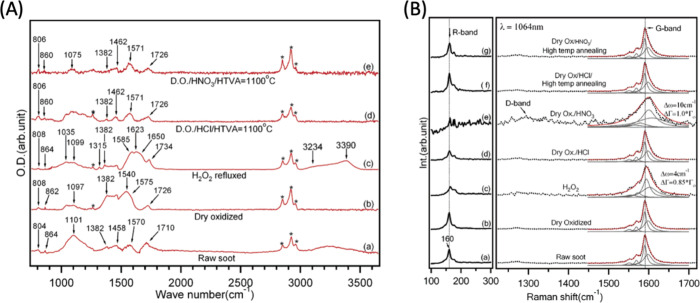
FTIR and Raman characterization of different
preparations of SWCNTs.
(A) FTIR spectra for raw SWCNT soot (a), dry oxidized (b), H2O2 refluxed (c), purified material via HCl and high-temperature
vacuum anneal (HTVA) treatment at 1100 °C (d), and purified material
via HNO3 and HTVA treatment at 1100 °C (e). The top
two spectra on purified SWCNTs represent the cleanest material. (B)
Raman spectra for the same SWCNT types from (A) showing R-band (100–300
cm–1) region (left panel) and D- and G-band region
(1230–1750 cm–1) (right panel). Reproduced
from ref (138). Copyright
2005 American Chemical Society.
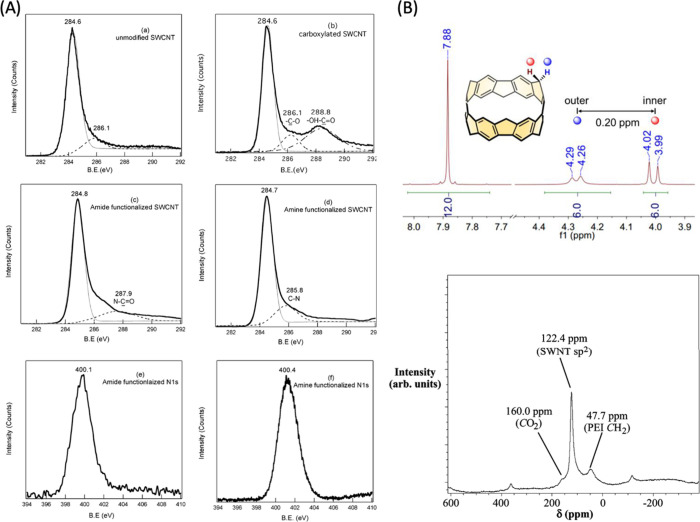
XPS and NMR characterization of CNMs.
(A) XPS spectra of (a) unmodified
SWCNT C 1s, (b) carboxylated C 1s, (c) amide-functionalized C 1s,
(d) amine-functionalized C 1s, (e) amide-functionalized N 1s, (f)
amine-functionalized N 1s. Reproduced from ref (150). Copyright 2005 American
Chemical Society. (B) (Top panel) 1H NMR spectrum of Methylene-Bridged
[6]CPP. Reproduced from ref (151). Copyright 2020 American Chemical Society. (Bottom panel)
Solid-state NMR spectra of polyethylenimine (PEI)-functionalized SWCNTs
via 13C MAS NMR spectrum with a 12 kHz spinning speed.
Reproduced from ref (152). Copyright 2008 American Chemical Society.
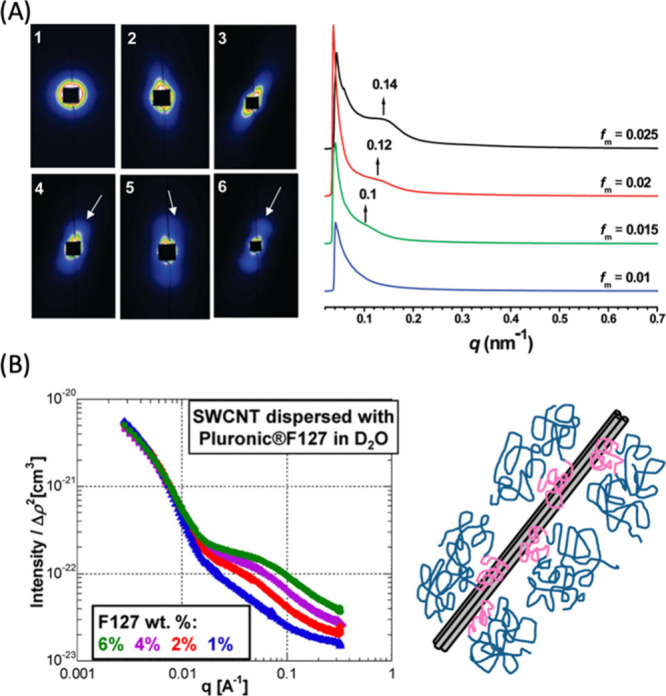
SAXS and SANS
characterization of CNMs. (A) (Left panel) SAXS patterns
of GO aqueous dispersions with maximum mass fraction (fm’s) of 2.5 × 10⁻⁴, 5 ×
10–3, 1 × 10⁻², 1.5 ×
10–2, 2 × 10⁻², and 2.5 ×
10–2, from 1 to 6. The white arrows indicate the
diffuse arc and the scattering peak. (Right panel) SAXS profiles of
liquid crystals of GO with high concentrations. The spectra depict
the scattering intensity as a function of scattering vector q (q = (4π sin θ)/λ,
where 2θ is the scattering angle). Reproduced from ref (157). Copyright 2011 American
Chemical Society. (B) (Left panel) SANS patterns of SWCNTs dispersed
in Pluronic F127 in 100% D2O, at four different concentrations
of 6, 4, 2, and 1% (%w/w). (Right panel) Schematic of dispersed SWCNTs.
Reproduced from ref (158). Copyright 2012 American Chemical Society.
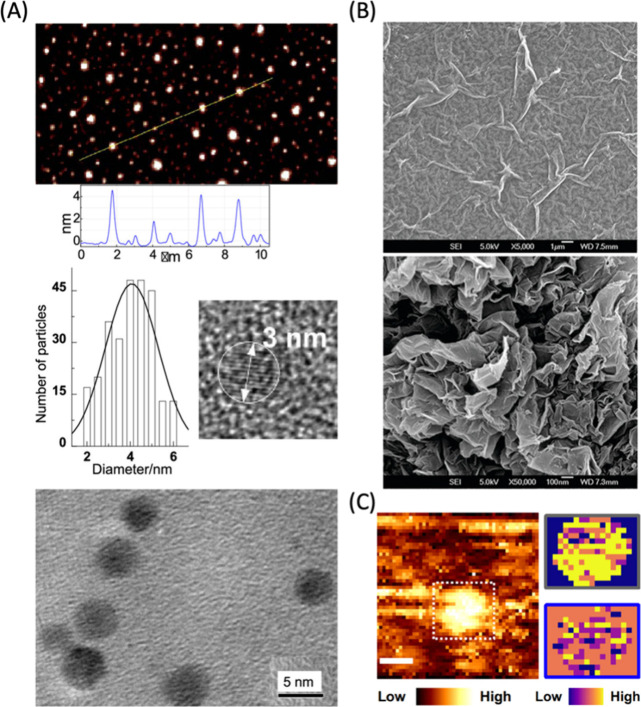
AFM, TEM, SEM,
and STM characterization of CNMs. (A) (Top) AFM
image of CDs with height profiles of some dots along the highlighted
line. (Middle left) Size distribution based on AFM height analyses,
(middle right) a high-resolution TEM image of CDs illustrating the
carbon core (Bottom) TEM image of the gold-doped CDs. Reproduced from
ref (173). Copyright
2014 American Chemical Society. (B) SEM images of GO and rGO nanosheets.
Reproduced from ref (174). Copyright 2011 American Chemical Society. (C) (Left) Topographic
STM image of a CD in the dashed white box with scale bar of 5 nm and
colormap indicating STM height. (Right) PCA and k-means clustering
of the tunneling spectroscopy data reveal low (blue) to high (yellow)
density of states showing localized defects of about 1–2 nm
in diameter. Reproduced from ref (175). Copyright 2020 American Chemical Society.
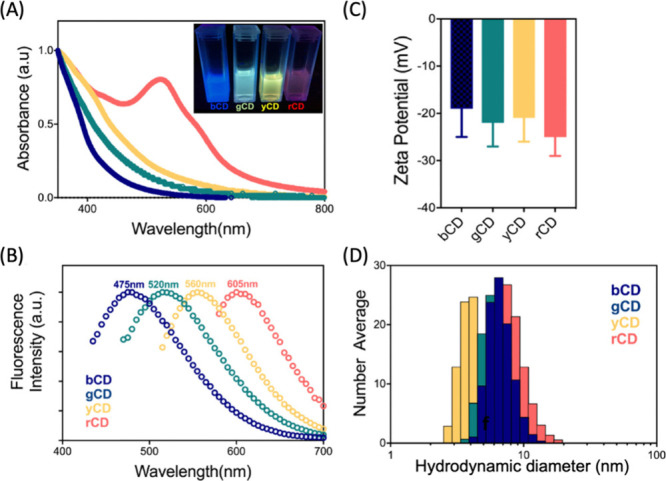
UV–vis-IR,
zeta potential, and size characterization of
CNMs. (A) UV–vis absorption spectroscopy of CDs with increasing
number of oxygen-containing defects (blue to red CDs). (B) Fluorescence
emission spectra of the four fractionated CD samples. (C) Zeta potential
measurements of four CDs. (D) Hydrodynamic diameter measurements by
DLS indicate no size trend of blue to red CDs. Reproduced from ref (175). Copyright 2020 American
Chemical Society.
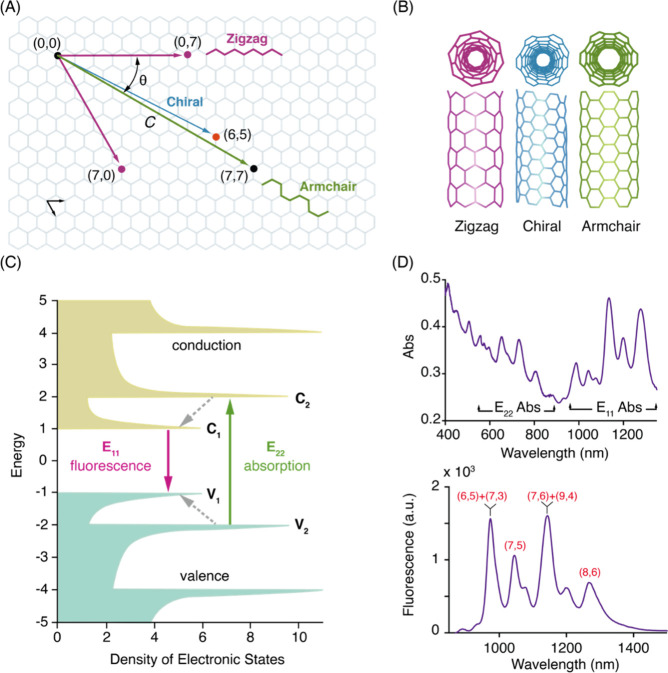
SWCNT photophysical
properties. (A) CNTs can be conceptualized
as graphene sheets rolled according to unique rollup vectors that
determine their optoelectronic properties and give rise to a diversity
of species. The direction and magnitude of the rollup vector is often
denoted by a pair of indices, (n, m), which can be thought of as scalar multipliers of the unit basis
vectors into which the roll up vector can be decomposed. (B) CNT species
can fall within three categories depending on the “twist”
of the graphitic lattice. (C) An electronic density of states for
a nanotube species of the semiconducting (chiral) type, with a small
but nonzero bandgap between the valence and conduction bands. Note
the sharp peaks in the density of states, which gives rise to “feature-rich”
spectra depicted in (D). Excitation is typically carried out using E22-lasers, and fluorescence emission is detected
with Stokes shift of >100 nm from the E11 state (equivalent to the first excited stated in molecular spectroscopy).
(D) Absorption (top) and fluorescence emission (bottom) spectra from
a multichiral (polydisperse) dispersion of single wall carbon nanotubes
synthesized by the HiPco method. λext = 785 nm is
typically used for broad resonant and off-resonance excitation of
nanotubes for most imaging applications. Peak assignments for some
of the prominent chiralities observed in HiPco samples are shown in
red text. For a thorough treatment of optical spectroscopy of SWCNTs,
the reader is invited to review Weissman et al.
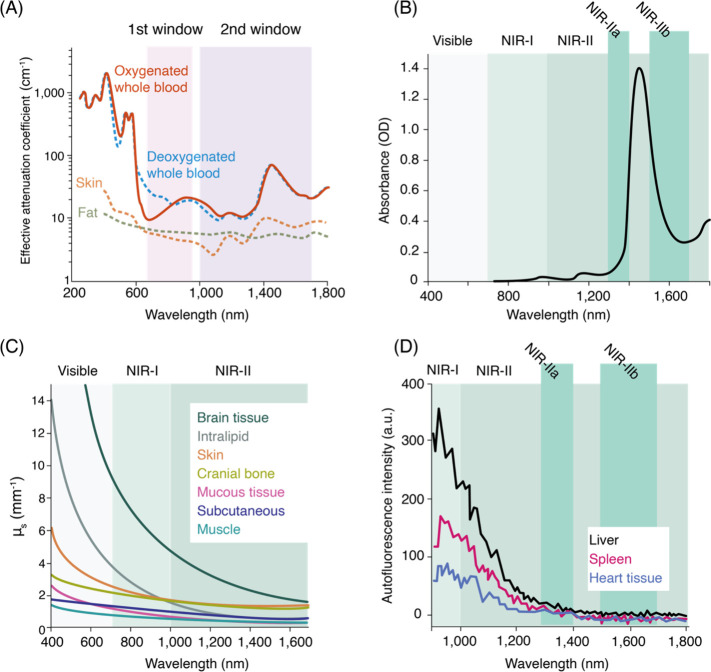
SWCNT photoluminescence in the NIR/SWIR window is coincident
with
reduced absorption, scattering, and autofluorescence from biological
samples. (A) Effective attenuation coefficients of skin and blood
in the 1st and 2nd NIR windows. (B) Absorption
by water from 400–1800 nm. (C) Reduced scattering coefficients
of various biological matrices exhibit monotonic decrease into the
NIR/SWIR window. (D) Autofluorescence spectra of ex vivo mouse tissues at 808 nm excitation. Reproduced from ref (251). Copyright 2018 American
Chemical Society.
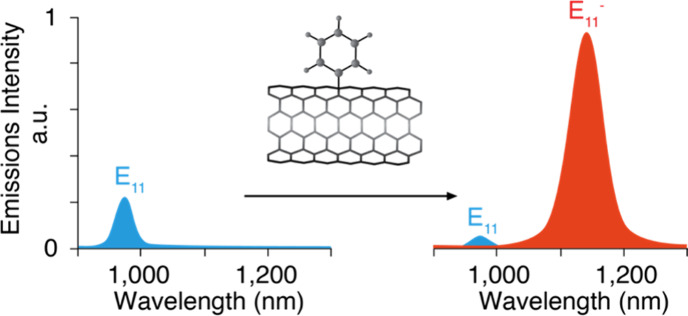
Engineered covalent adducts on SWCNTs
allow for tunable fluorescence
emission. Note the emergence of a brighter, red-shifted emission peak
(E11–) after functionalization
with covalent color centers.
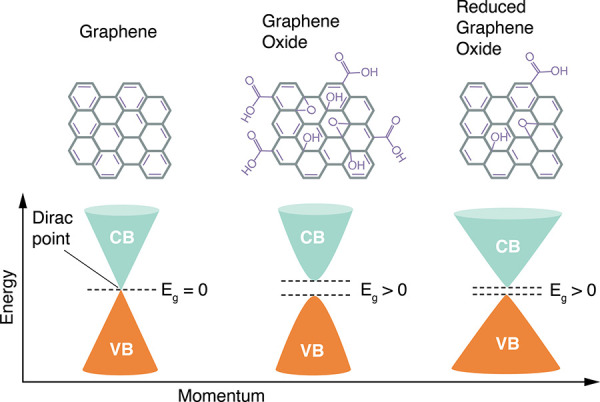
Electronic density of
states for graphene, GO , and RGO. Conduction
band (CB) is shown in blue and valence band (VB) is shown in orange.
Notice the absence of bandgap in graphene vs graphene oxide. Adapted
with permission from ref (385). Copyright 2018 Springer Nature under CC BY. http://tinyurl.com/yuh4xfa4 .
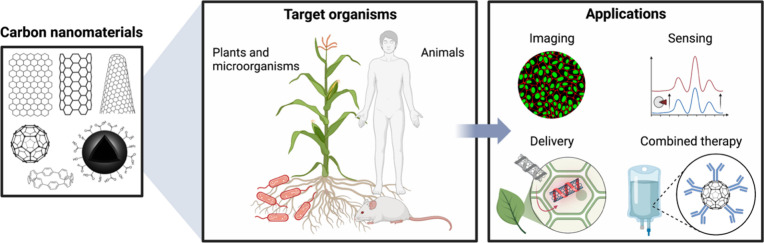
Various carbon nanomaterials
have been used in microorganisms,
plants, and animals for diverse applications in imaging, biosensing,
biomacromolecule and drug delivery, and combined therapy. Figure prepared
using BioRender.com .
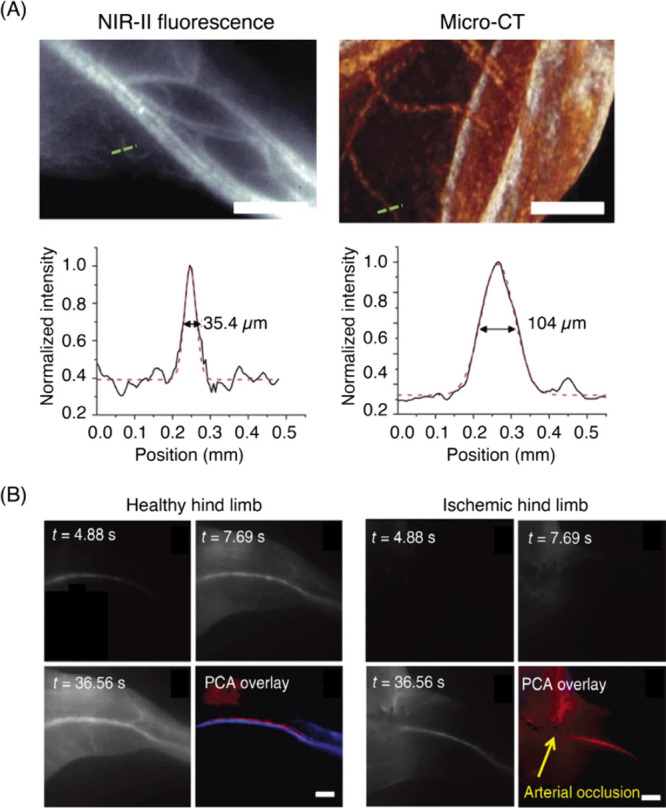
(A) NIR-II SWCNT fluorescence and micro-CT images of a
mouse thigh
(same area imaged in both modalities) and the cross-sectional intensity
profiles measured along the green dashed lines fitted with a Gaussian
distribution function (scale bar = 2 mm). (B) Time course NIR-II fluorescence
images of a hind limb blood flow in a healthy vs ischemic mouse. Principal
component analysis (PCA) revealed arteries and veins, color-coded
in red and blue, respectively (scale bar = 2 mm). Reproduced with
permission from ref (901). Copyright 2012 Springer Nature.
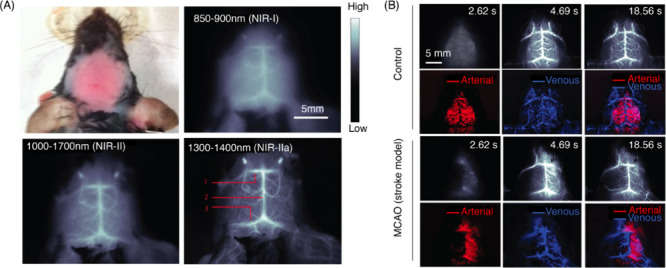
(A) Images of a head-shaved mouse and fluorescence images of the
same mouse in the NIR-I, NIR-II, and NIR-IIa windows after a tail
vein injection of SWCNTs. Inferior cerebral vein, superior sagittal
sinus, and transverse sinus are labeled as 1, 2, and 3. (B) Time course
NIR-IIa images (top rows) of a control (healthy) vs MCAO (stroke model)
mouse treated with SWCNTs. PCA overlaid images (bottom rows) showing
arterial (red) and venous (blue) vessels. Adapted with permission
from ref (904). Copyright
2014 Springer Nature.
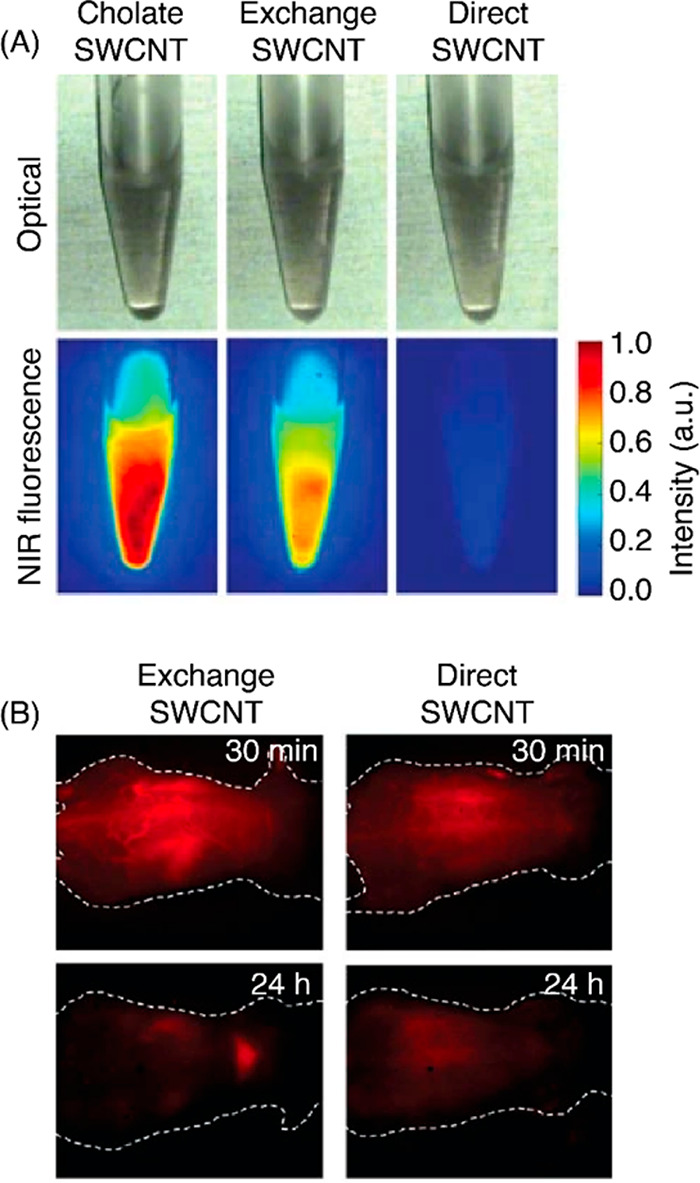
(A) Optical micrographs and NIR fluorescence
images of three SWCNT
preparations at equal concentrations. Emission was collected using
excitation at 808 nm. (B) NIR fluorescence images (1000–1700
nm) of nude mice treated with exchange or direct-SWCNTs at 30 min
and 24 h post tail vein injections. Reproduced with permission from
ref (910). Copyright
2009 Springer Nature.
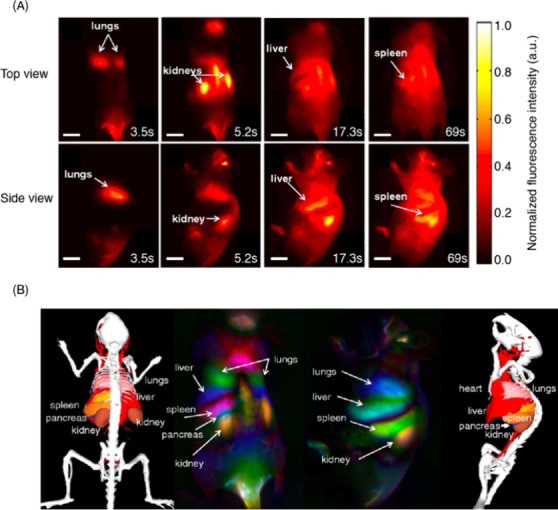
(A) Frames of video-rate imaging of a
mouse following a tail vein
injection with SWCNTs (scale bar = 1 cm). (B) Dynamic contrast-enhancing
imaging via PCA analysis. Adapted with permission from ref (911). Copyright 2011 Proceedings
of the National Academy of Sciences.
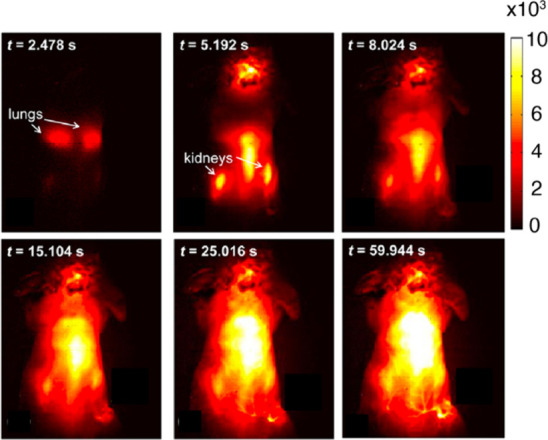
Time course NIR-II fluorescence
images of a 4T1 tumor bearing mouse
after injection of SWCNTs decorated with octadecene appended PEG chains.
Reproduced from ref (924). Copyright 2012 American Chemical Society.
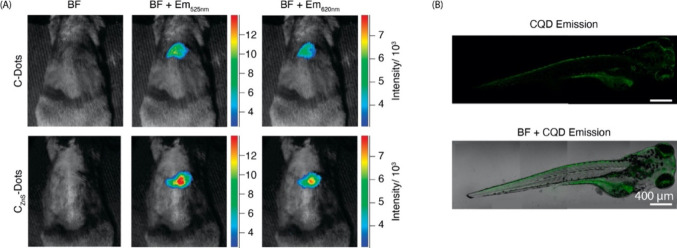
(A) Bright-field and merged fluorescence images
of mice subcutaneously
injected with CDs (top) and CZnS-Dots (bottom). Emission
at 525 and 620 nm were collected by 470 and 545 nm excitations, respectively.
Adapted with permission from ref (937). Copyright 2009 American Chemical Society.
(B) Fluorescence and bright-field merged images of a zebrafish incubated
with CQDs at 488 nm excitation. Adapted with permission from ref (942). Copyright 2020 Dove
Medical Press Limited.
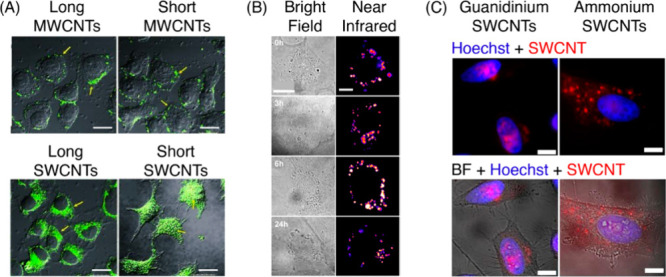
(A) Dependence of subcellular localization and cellular penetration
on the type and length of the CNMs. The diameters of MWCNTs were 10–30
nm and SWCNTs were 1–3 nm. Length distributions for long MWCNT,
short MWCNT, long SWCNT, and short SWCNT were 1–2 μm,
0.5–1 μm, 100–200 nm, and 50–100 nm, respectively.
Nanotubes were conjugated to Alexa Fluor 488, and merged images of
bright-field and fluorescence are presented. Scale bar is 20 μm.
Adapted with permission from ref (960). Copyright 2010 Wiley-VCH. (B) Transmitted
light and broadband NIR fluorescence (950–1350 nm) time lapse
images of human umbilical vein endothelial (HUVEC) cells stained with
1 mg L–1 (GT)30-SWCNTs for 1 h. Scale
bars for transmitted and NIR fluorescence images are 20 and 10 μm,
respectively. Reproduced from ref (961). Copyright 2021 American Chemical Society.
(C) Subcellular localization of HeLa cells costained with guanidinium-
or ammonium-polymer coated SWCNTs and Hoechst 33258. Scale bar is
10 μm. Reproduced from ref (962). Copyright 2017 American Chemical Society.
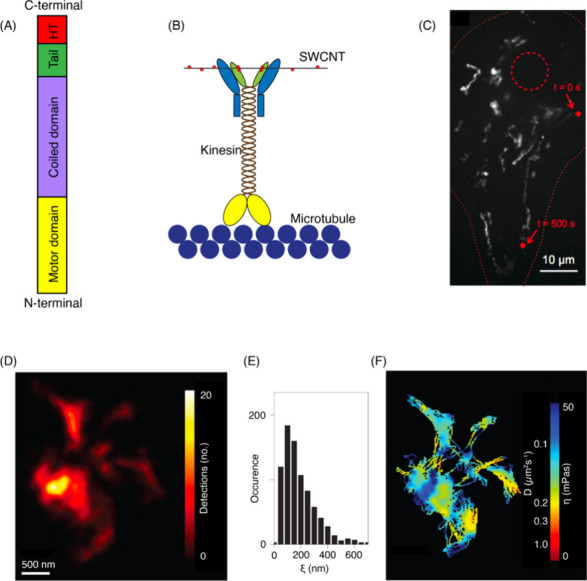
(A) Schematic of kif5c
and HaloTag (HT) protein fusion. (B) SWCNTs
are bound to the kinesin via their HT ligand surface motifs. (C) Movement
of kinesin labeled with SWCNTs is tracked in a COS-7 cell line. Nucleus
and periphery are outlined in red dashed and dotted lines, respectively.
The red diamond marks beginning and end of the 500 s trajectory over
40 μm. Adapted with permission from ref (963). Copyright 1979 American
Association for the Advancement of Science. (D) Super resolved image
of an ECS obtained from 20,000 localizations of a diffusing SWCNT.
(E) Characteristic length scales of ECS microdomains pooled from many
tracking experiments. (F) Diffusion coefficients and viscosity of
the ECS computed from single particle tracking experiments. Adapted
with permission from ref (966). Copyright 2017 Springer Nature.
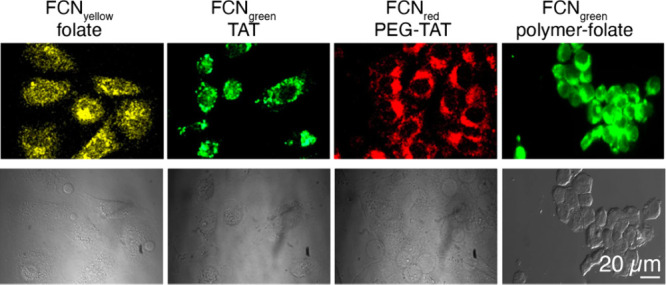
HeLa cells stained with functionalized fluorescent CDs
with tunable
emission profiles. Cells were imaged under fluorescence (top) and
bright-field (bottom) modes. Adapted with permission from ref (983). Copyright 2013 Springer
Nature. FCN stands for fluorescent carbon nanoparticles, which we
collectively refer to as CDs in this review.
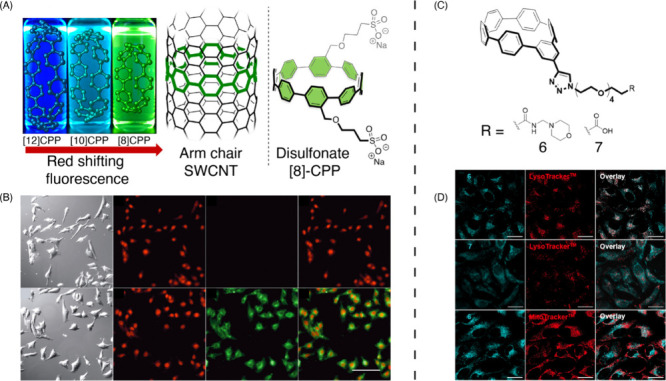
Live cell
imaging using carbon nanohoops. (A) CPPs can be conceptualized
as the smallest macrocyclic slices of an armchair nanotube. Notice
the counter-intuitive red shifting of fluorescence as ring size decreases.
Right: structure of cell permeable disulfonate [8]CPP, used for live
cell imaging depicted in panel B. (B) Bright-field, nuclear (NucRed,
red) and cytoplasmic (disulfonate [8]CPP, green) images of HeLa cells,
and overlay between red and green channels. Top row: imaged in the
absence of disulfonate [8]CPP. Reproduced from ref (1011). Copyright 2018 American
Chemical Society. (C) Structure of meta[6]CPP with
PEG chains to enhance aqueous solubility, capped with subcellular
targeting ligands (R). (D) Top row: Lysosome-targeting motif enables
localization of meta[6]CPP punctate signal to lysosome
(good overlap with LysoTracker). Middle row: Nanohoop without lysosome-targeting
motif exhibits diffuse labeling and poor overlap with LysoTracker.
Bottom row: lysosome-targetted nanohoops show poor overlap with MitoTracker,
a mitochondrial marker. Reproduced from ref (1013). Copyright 2021 American
Chemical Society.
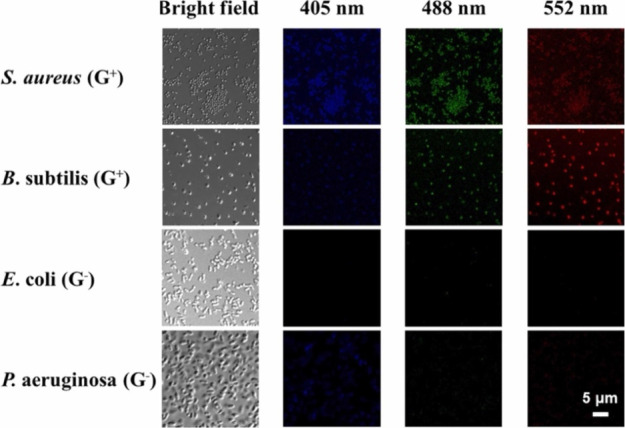
Confocal images after
a 2-h treatment with CDs@MR-1, showcasing
two Gram-positive bacterial strains (S. aureus and B. subtilis) and two Gram-negative bacterial strains (E. coli and P. aeruginosa). Adapted with
permission from ref (1031). Copyright 2022 Elsevier.
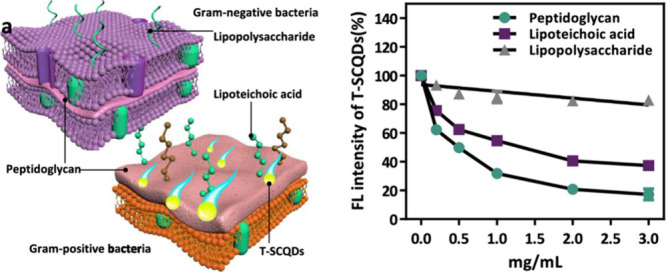
(Left) Schematics of
Gram-negative and Gram-positive bacteria cell
walls. (Right) Competition assay using T-SCQDs at a concentration
of 500 μg/mL with peptidoglycan, lipoteichoic acid, and lipopolysaccharide
to assess their binding affinity toward peptidoglycan and lipoteichoic
acid. Adapted from ref (1032). Copyright 2021 American Chemical Society.
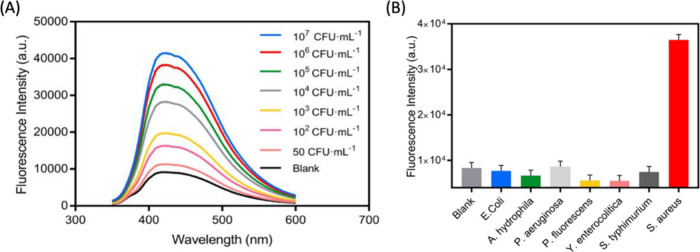
(A)
Fluorescence emission spectra of Fe3O4/CD aptasensor
after incubation with different concentrations of S. aureus
in vitro. (B) An investigation into the aptasensor’s
specificity for the detection of S. aureus, E. coli, A. hydrophila, P. aeruginosa, P. fluorescens, Y. enterocolitica, and S. typhimurium, each at a concentration of
105 CFU·mL–1. Adapted from ref (1035). Copyright 2019 American
Chemical Society.
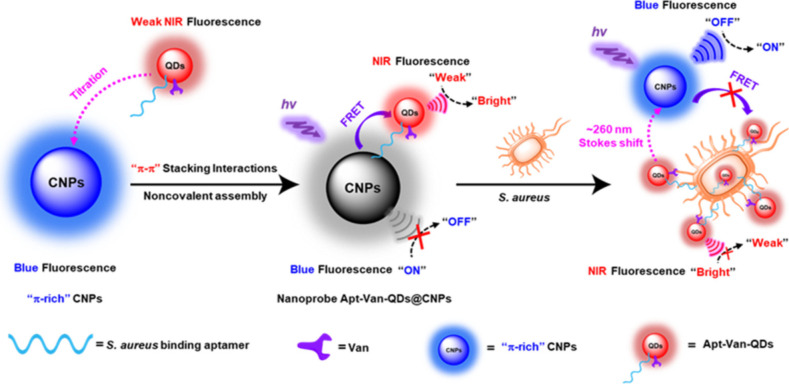
Ratiometric fluorescent
nanoprobe, which utilizes both vancomycin
and aptamer dual-recognition elements, offers an extensive Stokes
shift. Adapted from ref (1036). Copyright 2020 American Chemical Society.
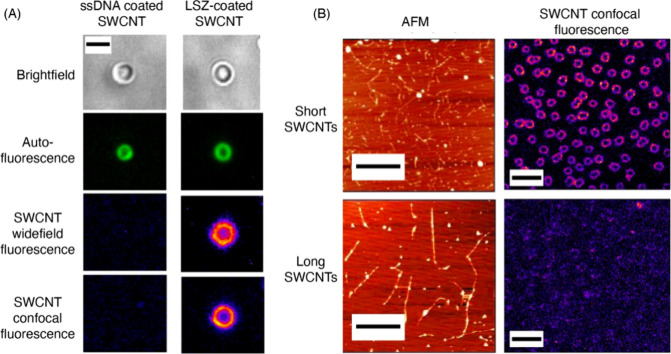
(A) Bright-field, autofluorescence, and
NIR fluorescence (both
under wide field and confocal modes) of Synechocystis cells incubated with ssDNA- or LSZ-wrapped SWCNTs. Note LSZ-coated
SWCNTs efficiently label bacterial cells, while ssDNA-coated SWCNTs
do not (scale bar = 3 μm). (B) AFM images of short and long
SWCNTs (scale bar = 1 μm) and NIR fluorescence images of Synechocystis cells incubated with short and long SWCNTs
(scale bar = 10 μm). Adapted with permission from ref (1037). Copyright 2022 Springer
Nature.
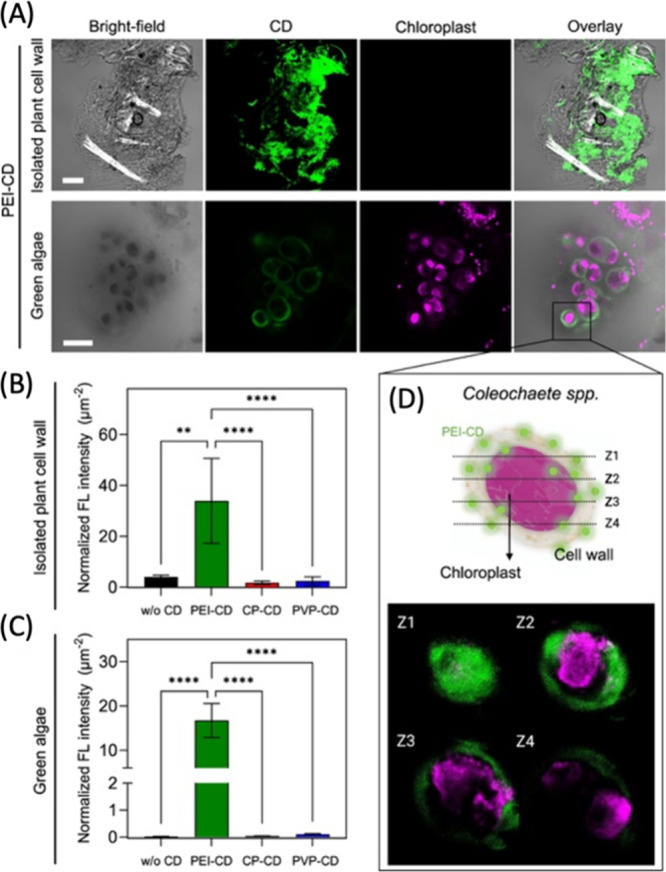
Interactions between carbon dots and the cell walls of
native plants
and algae. (A) Confocal images showing the cell walls isolated from Arabidopsis plant leaves and live green algae (Coleochaete). The scale bar in the images is 100 μm. (B) Comparative analysis
of CD fluorescence intensity, which was normalized by the imaging
area, for the cell walls of native plants and algae based on multiple
confocal images (n = 3–9). Different letters
in the graph represent statistically significant differences, as determined
by one-way ANOVA and Tukey test (** p < 0.01,
**** p < 0.0001). (C) The z-stack images depict
the binding of PEI-CDs to the cell wall and membrane of algae, with
chloroplasts shown in magenta. Adapted from ref (1056). Copyright 2023 American
Chemical Society.
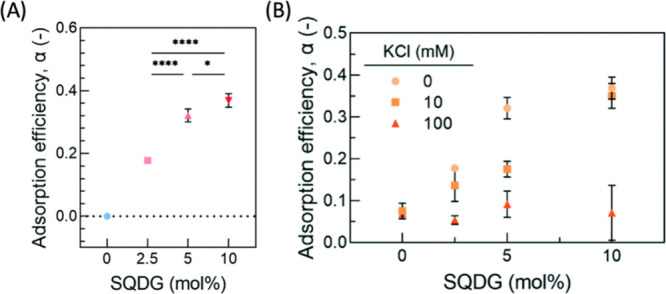
(A) Evaluation of the
adsorption efficiency of PEI-CNDs on bilayers
containing 0–10% SQDG. The adsorption efficiency was determined
as zero for the 0% SQDG bilayer since the exposure to PEI-CNDs did
not result in detectable frequency changes. (B) Adsorption efficiencies
of PEI-CNDs on 0–10% SQDG containing bilayers under 0–100
mM KCl, showing effects of increasing ionic conditions. Adapted from
ref (1061). Copyright
2022 American Chemical Society.
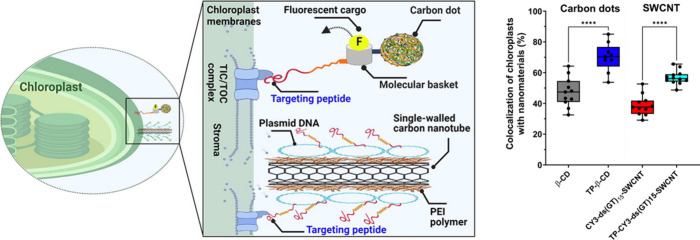
(Left) Schematics of CNM targeting to plant chloroplasts.
(Right)
The analysis of colocalization in nanostructures revealed a notably
increased proportion of chloroplasts containing targeted nanomaterials,
in contrast to the control group lacking TPs. Statistical evaluation
was performed using one-way ANOVA and post hoc Tukey’s test,
with a sample size of 7 to 12, yielding a highly significant result
with p < 0.0001. Adapted from ref (1066) Copyright 2022 American
Chemical Society.
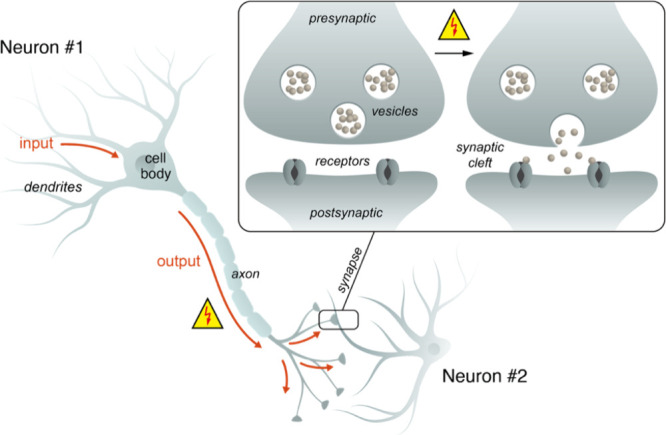
Neurons receive input
through dendrites, integrate this input at
the cell body, and send information out to neighboring neurons through
their axons. Communication occurs via interfaces known as chemical
synapses that convert electrical signals in axons to chemical signals
that are released via vesicular exocytosis (inset).
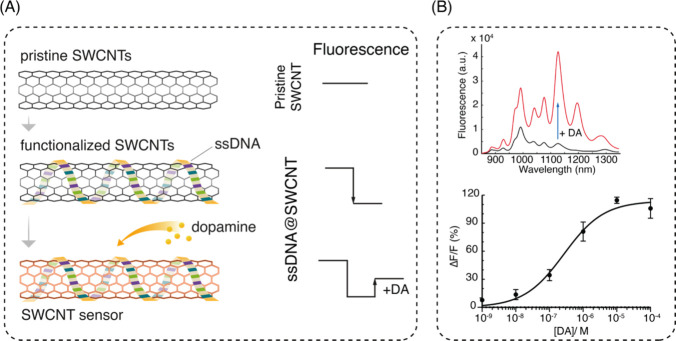
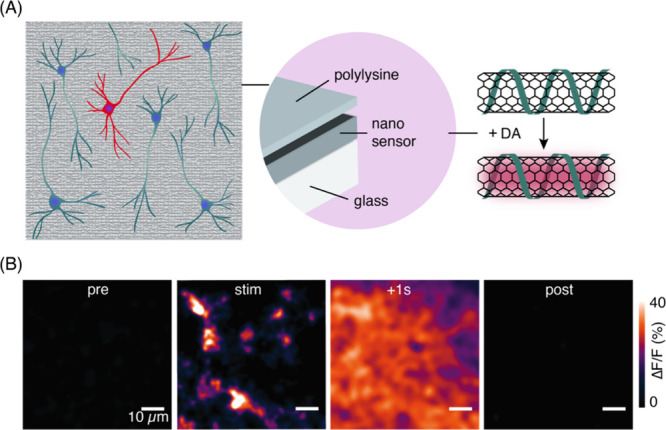
SWCNT-based sensors for the catecholamine dopamine. (A)
Pristine
nanotubes surface functionalized with a short, 12-mer oligonucleotide
sequence (GT)6 exhibits a strong turn-on sensitivity to
dopamine. The ssDNA coat affords colloidal stability and tiles the
surface of nanotubes, creating binding pockets for dopamine molecular
recognition. Ligand binding is transduced via modulation of the nanotube’s
fluorescence emission. To the right: current model of how the sensor
is thought to work. Dispersions of ssDNA@SWCNT exhibit quenched fluorescence,
which is partially rescued by the addition of dopamine (+DA). (B)
Top: Fluorescence spectra of a polydisperse nanotube colloid before
(black) and after (red) addition of 10 μM dopamine (+DA) in
solution. Bottom: Dose response curve for surface immobilized nanotubes
show half maximal response (EC50) of ∼250 nM.
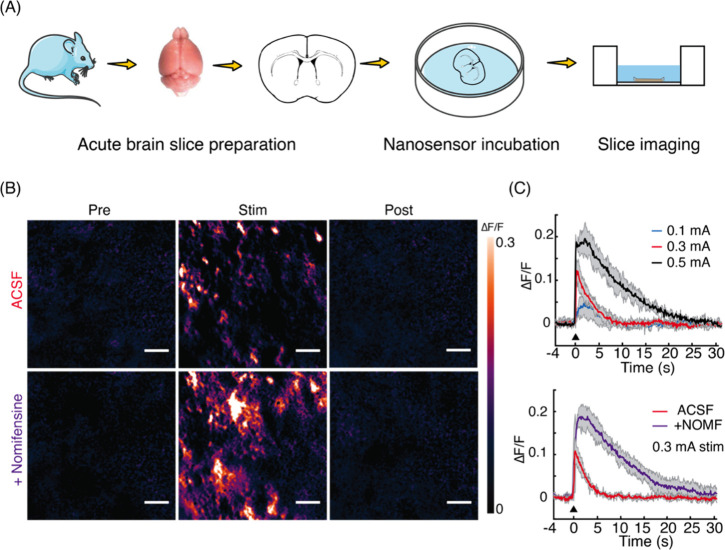
Imaging of dopamine
release from brain slice tissue. (A) Brain
slices are incubated in solutions that contain dopamine nanosensors.
This process delivers the nanosensors into the brain slice through
passive diffusion. (B) Electrical stimulation derives dopamine release,
which are detected as hotspots by dopamine nanosensors. Application
of nomifensine (bottom row) delays the clearance kinetics of dopamine
and increases spatial extent of dopamine diffusion relative to standard
imaging buffer (ACSF) (scale bar = 10 μm). (C) Spatially averaged
traces of nanosensor fluorescence transients under various stimulation
paradigms (top) and pharmacological perturbations (bottom with nomifensine,
+NOMF). Reproduced with permission from ref (1088). Copyright 2019 American
Association for the Advancement of Science.
(A) Composite nanofilm
strategy for culturing primary dopaminergic
neurons. Dopamine neurons are cultured on fluorescent and dopamine
sensitive substrate produced from drop casting a solution of ssDNA@SWCNT
conjugates on glass surfaces. (B) Dopamine release evoked by field
stimulation modulates the fluorescence of the nanosensor layer, which
is recorded as a “hotspot” of activity (a cluster of
pixels that exhibit highly correlated temporal behavior). Images show
temporal evolution of signal. Reproduced with permission from ref (1090). Copyright 2022 Elife under CC BY 4.0.
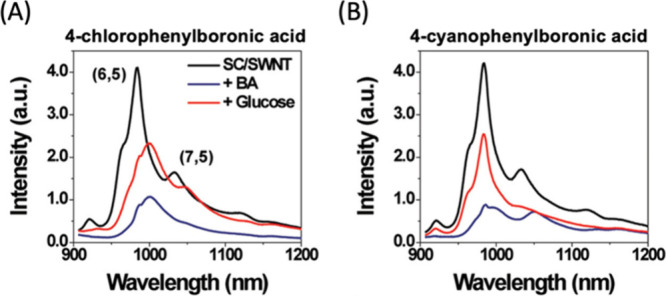
Fluorescence spectra that compare the original
spectrum of SWCNTs
(black), the spectrum after adding 50 mM boronic acid (blue), and
the spectrum after adding 50 mM glucose (red). (A) The BA-SWCNT complexes
were prepared with 4-chlorophenylboronic acid and (B) 4-cyanophenylboronic
acid. Adapted from ref (1125). Copyright 2011 American Chemical Society.
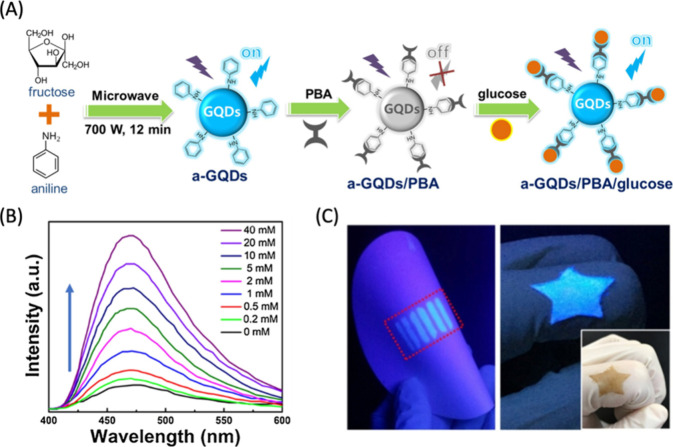
(A) Schematic illustration of a-GQDs synthesis and its
glucose
sensing mechanism. (B) Fluorescence spectra of a-GQDs/PBA with different
glucose concentrations showing the turn-on sensor response. (C) Portable
paper-based printed sensor and a wearable composite thin-film sensor
responding to patient glucose levels. Adapted with permission from
ref (1128). Copyright
2021 Elsevier.
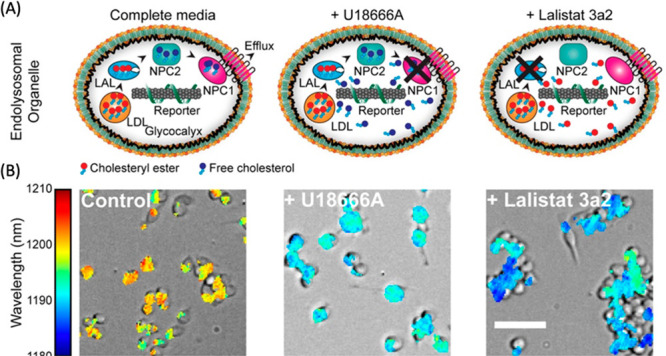
Detection of endolysosomal lipid accumulation
in live cells. (A)
Schematics of the ss(GT)6-(8,6) SWCNTs in macrophages treated
with compounds that accumulate lipids in cells (U18666A or Lalistat
3a2). (B) Overlay of brightfield and hyperspectral images of macrophages
incubated with sensors under the specified treatments. Color legend
maps to nanotube emission peak wavelength. Scale bar = 50 μm.
Adapted from ref (1132). Copyright 2017 American Chemical Society.
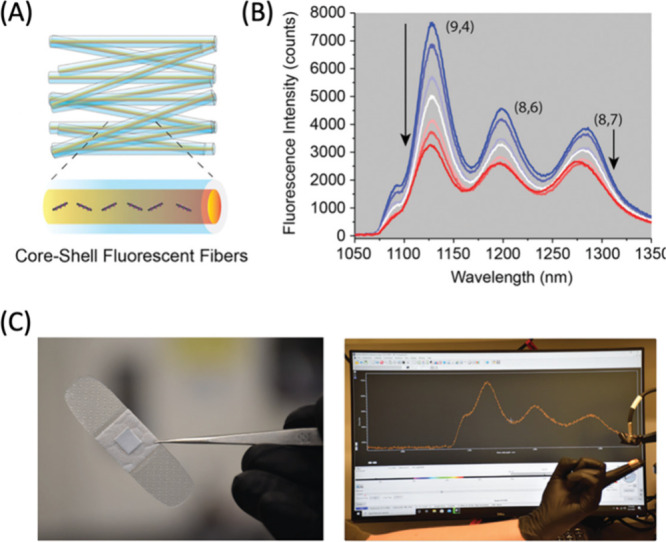
(A) Schematic of the
ss(GT)15-SWCNT sensors encapsulated
in PCL polymers. (B) The fluorescence spectra of the microfibrous
samples exposed to various H2O2 concentrations
ranging from 0 to 5 mM. (C) Optical fibrous samples that are integrated
into a commercial wound bandage still responds to exogenously applied
H2O2. Adapted with permission from ref (1140). Copyright 2021 Wiley.
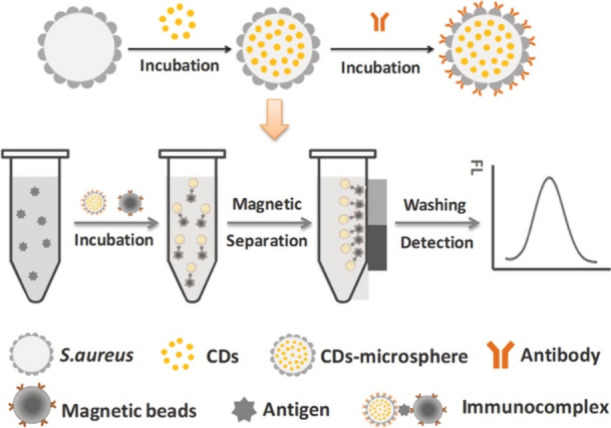
A method
for creating cell-based CDs-microspheres utilizing S. aureus cells as carriers to encapsulate CDs particles.
These inactivated cells can subsequently bind to antibody molecules
via SPA proteins present on their surfaces. The development of the
CDs-microsphere immunoassay involves the integration of immunomagnetic
separation and CDs-microsphere fluorescence detection for pathogen
detection. Adapted with permission from ref (1160). Copyright 2021 Elsevier.
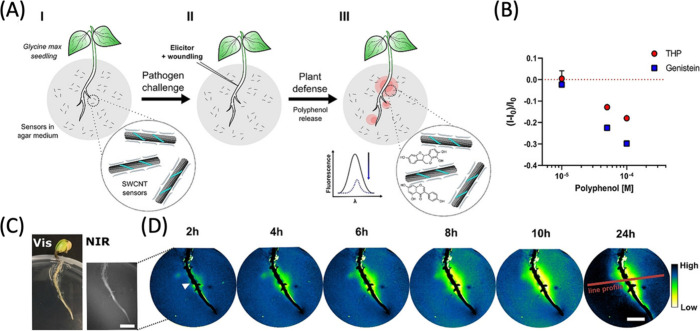
(A) The use of SWCNT-based
fluorescent sensors integrated into
the agar culture medium. A soybean seedling (G. max) grows through the agar, and when the plant encounters a pathogenic
elicitor, its response in terms of polyphenol secretion is monitored
through NIR fluorescence imaging from a distance of more than 20 cm.
(B) Genistein and THP, which are significant components of soybean
(G. max) polyphenols, reduce the fluorescence of
PEG-PL-SWCNTs in the agar (mean ± SD, n = 3).
(C) Visible and NIR images of the soybean seedling with a scale bar
of 1 cm. (D) The NIR fluorescence of the sensors (I/I0) in the plant’s environment
(rhizosphere) decreases over time near the challenged root area (where
root tissue is indicated by black overlay; the white triangle represents
the position for elicitor induction, and the red line shows the line
profile position, with a scale bar of 1 cm). Adapted with permission
from ref (1159). Copyright
2022 Wiley.
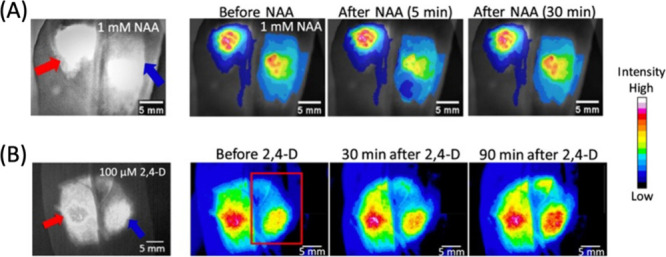
Spatial and temporal patterns of NAA and 2,4-D in spinach
leaves.
(A) Bright-field and false-color fluorescent images of a spinach leaf
from a whole plant, showing infiltration with reference (red) and
1 mM NAA (blue) sensors under 785 nm laser light after 5 and 30 min.
(B) Bright-field and false-color fluorescent images of a spinach leaf
with reference (red) and 100 μM 2,4-D (blue) sensors under 785
nm laser light after 30 and 90 min. Adapted from ref (1248). Copyright 2021 American
Chemical Society.
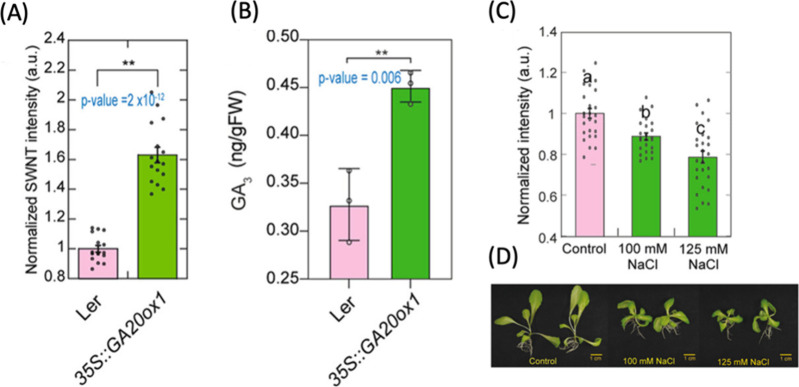
(A) The integrated fluorescence
intensity was quantified for both
Ler and GA20ox1 seedlings, and then standardized against the fluorescence
intensity of Ler seedlings. The resulting graphs display the average
standardized fluorescence intensities along with their standard deviations,
with each data point represented by dots. (B) Biochemical determination
of GA3 levels in wild-type (Ler) and 35S::GA20ox1 overexpression
lines was conducted. Gibberellins were extracted from seedlings aged
10 days and their concentrations were measured using LC-MS/MS analysis.
(C) Normalized fluorescence intensity of GA3-SWNT in the
roots of lettuce for various NaCl treatments, based on 21–25
data points gathered from six seedlings across two independent experiments.
(D) Lettuces at the age of 10 days, treated with either no NaCl or
with 100 or 125 mM NaCl for an additional 10 days. Adapted from ref (1251). Copyright 2023 American
Chemical Society.
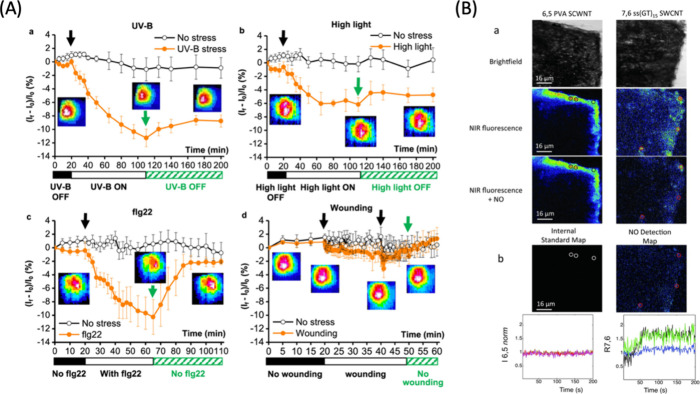
(A) Plant health is monitored real-time using optical
techniques
by employing H2O2 nanosensors. The changes in
NIR fluorescence intensity of HeAptDNA-SWCNT sensors in leaves (as
shown in color map insets) provide information about the initiation
of various environmental stresses, such as UV-B radiation, intense
light exposure, and stress caused by pathogen-associated peptides
like flg22. Adapted from ref (1225) with permission. Copyright 2020 American Chemical Society.
(B) The response of a ratiometric sensor to H2O2 inside leaves is observed in vivo. Leaf sections
are infiltrated with a ratiometric sensor consisting of a 6,5 ss(AT)15 strand and a 7,6 ss(GT)15 strand, each with different
chiralities. These chiralities are independently imaged using a 785
nm excitation source. The internal standard and H2O2 detection are represented in maps based on the change in
NIR intensity within the leaf section. Adapted from ref (1228). Copyright 2020 American
Chemical Society.
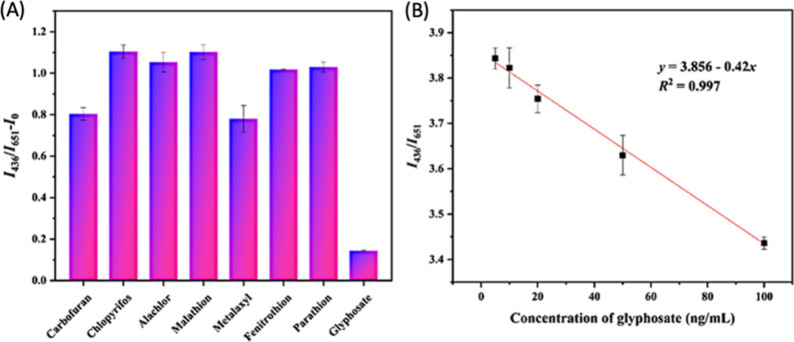
(A) Ratiometric fluorescence responses of N-CDs@SiO2@BSA-AuNCs with Cu2+ in response to glyphosate and seven
other pesticides at a concentration of 100 ng/mL, and (B) the linear
correlation between the I436/I651 intensity ratio and glyphosate concentrations ranging
from 5 to 100 ng/mL. Adapted from ref (1258). Copyright 2023 American Chemical Society.
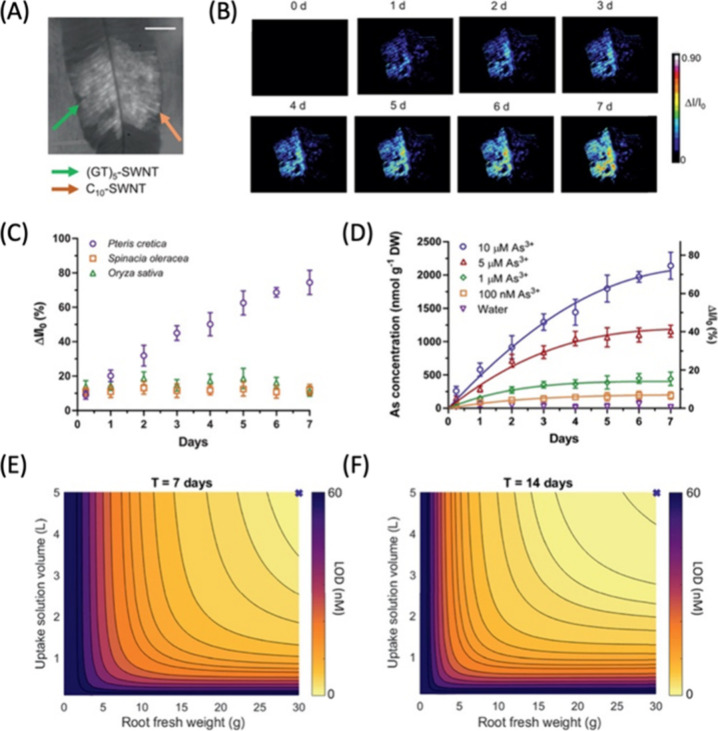
(A) Bright-field visualization of Pteris cretica leaf with (GT)5-SWCNT and C10-SWCNT, excited
at 785 nm. Scale bar = 0.5 mm. (B) Sequential images depicting intensity
variation in nanosensors following arsenite exposure, with timestamps
postarsenite application via roots. (C) Comparison of fluorescence
intensity shifts in SWCNT nanosensors within spinach, rice, and Pteris cretica under 10 μM arsenite-treated root medium.
(D) Arsenite levels in Pteris cretica leaves subjected
to varying arsenite concentrations (10, 5, 1, 0.1 μM) and deionized
water in the root medium. (E) Contour plot of sensor’s detection
limit after 7 days. Cross indicates the detection limit of 4.7 nM
(0.6 ppb). (f) Contour plot of sensor’s detection limit after
14 days. Cross indicates the detection limit of 1.6 nM (0.2 ppb).
Adapted with permission from ref (1261). Copyright 2021 Wiley.
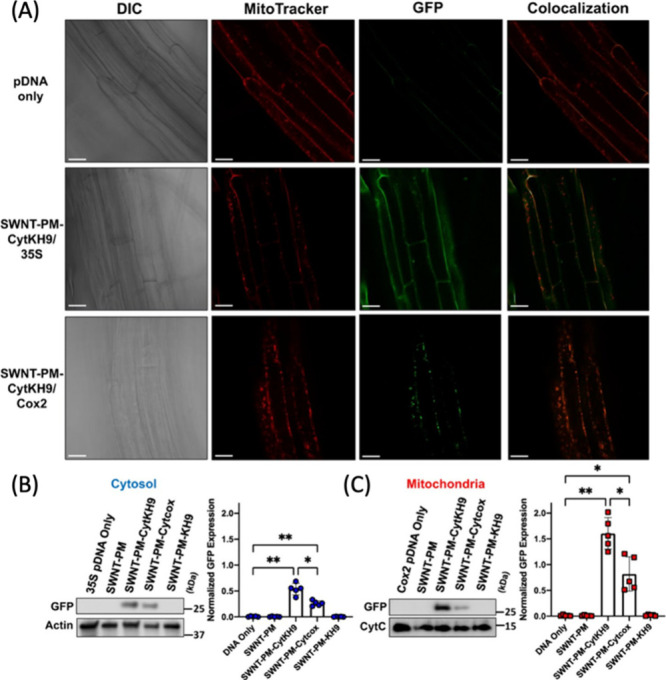
(A) Confocal
laser scanning microscopy is utilized to determine
GFP expression 18 h postinfiltration of two different plasmid constructs pDONR-35S-GFP with a 35S (nuclear) promoter and pDONR-Cox2-GFP with a cox2 (mitochondrial) promoter delivered
with SWCNT-PM-CytKH9. (B, C) Quantification of protein expression
via SWCNT-cytKH9 in plants by Western blotting shows GFP protein presence
in both the cytosol (b) and mitochondria (c) 18 h postinfiltration.
Adapted with permission from ref (1293). Copyright 2022 Nature.
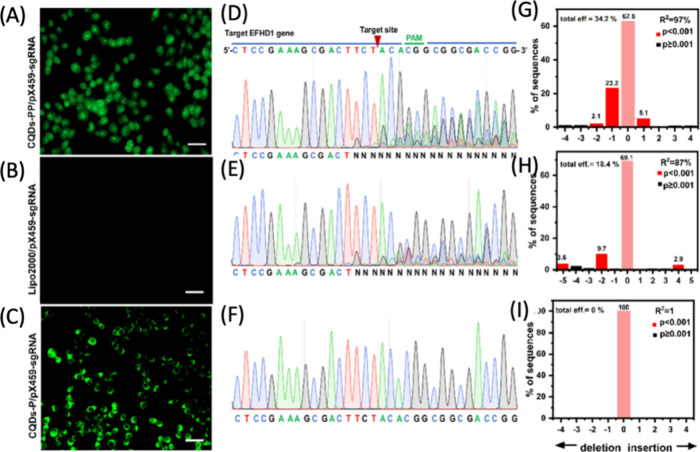
(A–C) The tracking of CQD-PP (A), Lipo2000 (B), and CQD-P
(C) through fluorescence microscopy. (D–F) Insertion/deletion
of nucleotides utilizing CQD-PP/pX459-sgRNA, Lipo2000/pX459-sgRNA,
and CQD-P/pX459-sgR, respectively. (G–I) The quantification
of gene editing efficiencies for CQD-PP/pX459-sgRNA (34.2%), Lipo2000/pX459-sgRNA
(18.4%), and CQD-P/pX459-sgR(0%) of EFHD1 gene in
HeLa cells. Adapted with permission from ref (1296). Copyright 2022 Royal
Society of Chemistry.
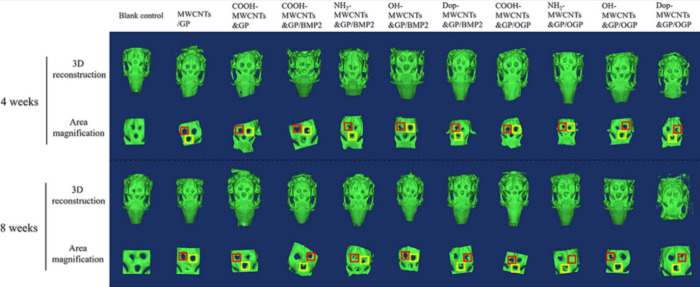
A 3D reconstruction of the rabbit calvarial defects conferred
to
measure the regeneration of bone for chemically distinct (neat, −COOH,
−NH2,–OH, dopamine) MWCNTs (red) and graphene
(yellow) particles decorated with BMP2 and/or OGP peptides at 4 and
8 weeks. The reconstruction is utilized to measure the growth of new
bone as demonstrated by all the CNM conjugate implantations. Adapted
with permission from ref (1297). Copyright 2022 Elsevier.
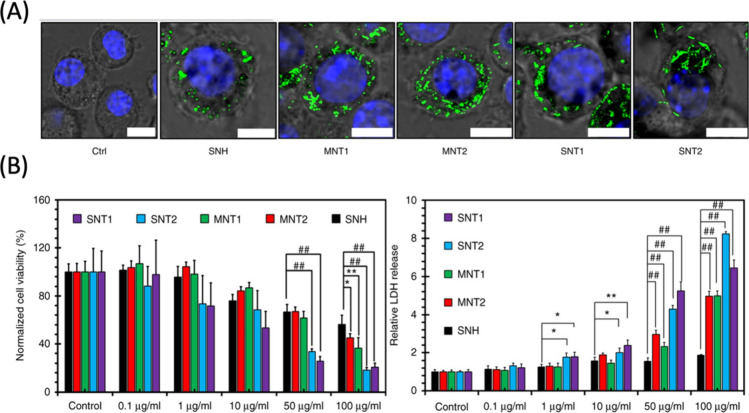
(A)
Confocal images of cells after nanocarbon incubations. Intracellular
nanocarbons were detected by laser reflection (LR) technology and
shown with pseudo green color showing less cell entry of SNHs. Scale
bar = 10 μm. (B) Cellular viability comparisons of different
nanocarbons detected by a MTT assay (left) and LDH release investigations
(right) (n = 5). Adapted with permission from ref (1304). Copyright 2018 Nature.
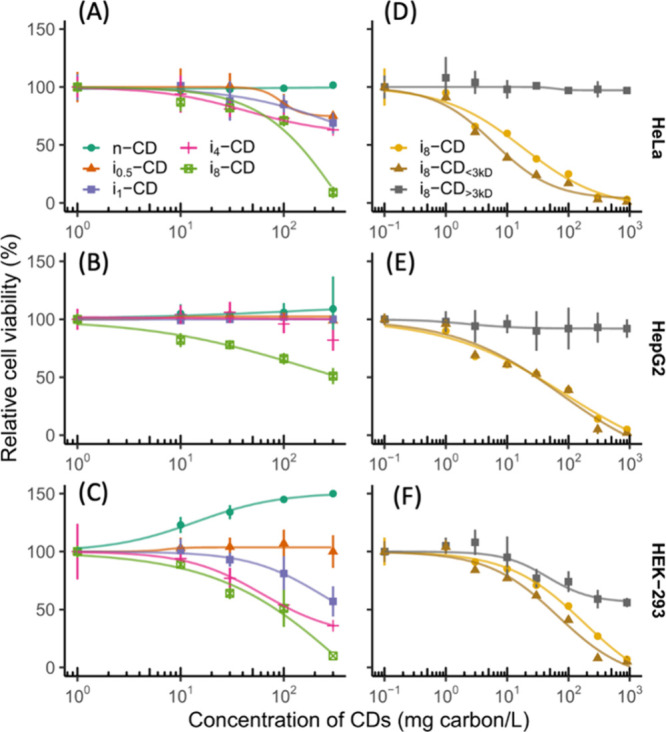
(A–C) Relative
cell viability of three cell types (HeLa
[a], HepG2 [b], HEK-293 [c]) at 24 h postincubation with 5 samples
(n-CD, i0.5-CD, i1-CD, i4-CD, i8-CD) individually at different concentrations (0, 10, 30,
100, and 300 mg carbon/L), where n-CD is the nonirradiated CDs and n in in-CD indicates the number
of days the CDs were irradiated with 60 μmol photons/m2/s. Trends depict decreased cell viability with longer irradiation
times. (D–F) The relative cell viability of three cell types
(HeLa [d], HepG2 [e], HEK-293 [f]) at 24 h postincubation of three
CD samples (i8-CD, i8-CD>3kD,
i8-CD<3kD). Similarly, i8-CD demonstrates
CDs
irradiated with 60 μmol photons/m2/s for 8 days and where i8-CD>3kD and i8-CD<3kD indicate the
molecular
size of the fraction tested from an original i8-CD sample.
Trends depict the increase cytotoxicity with i8-CD<3kD and i8-CD indicative of increased cytotoxicity with
photolyzed carbon dot products which have a size of <3kD. Adapted
with permission from ref (1309). Copyright 2021 Nature.
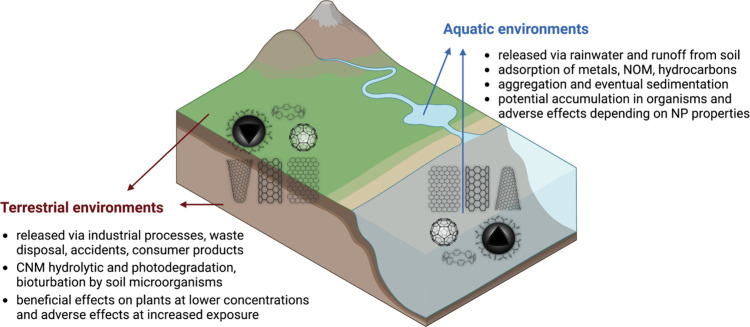
Accumulation and fate of CNMs in aquatic and
terrestrial environments.
Figure prepared using BioRender.com .
Similar articles
-
Aptamer-assembled nanomaterials for biosensing and biomedical applications.Small. 2011 Sep 5;7(17):2428-36. doi: 10.1002/smll.201100250. Epub 2011 Jul 4. Small. 2011. PMID: 21726041 Review.
-
Recent applications of carbon nanomaterials in fluorescence biosensing and bioimaging.Chem Commun (Camb). 2015 Jul 21;51(57):11346-58. doi: 10.1039/c5cc02887f. Chem Commun (Camb). 2015. PMID: 25990681 Review.
-
Using Nanomaterials as Excellent Immobilisation Layer for Biosensor Design.Biosensors (Basel). 2023 Jan 27;13(2):192. doi: 10.3390/bios13020192. Biosensors (Basel). 2023. PMID: 36831958 Free PMC article. Review.
-
Carbon nanomaterials: multi-functional agents for biomedical fluorescence and Raman imaging.Chem Soc Rev. 2015 Jul 21;44(14):4672-98. doi: 10.1039/c4cs00306c. Chem Soc Rev. 2015. PMID: 25406743 Review.
-
Progress and Prospects on the Fabrication of Graphene-Based Nanostructures for Energy Storage, Energy Conversion and Biomedical Applications.Chem Asian J. 2021 Jun 1;16(11):1365-1381. doi: 10.1002/asia.202100216. Epub 2021 May 7. Chem Asian J. 2021. PMID: 33899344 Review.
Cited by
-
Integrating Single-Walled Carbon Nanotubes into Supramolecular Assemblies: From Basic Interactions to Emerging Applications.ACS Nano. 2024 Oct 29;18(43):29380-29393. doi: 10.1021/acsnano.4c06843. Epub 2024 Oct 20. ACS Nano. 2024. PMID: 39428637 Free PMC article. Review.
-
Functionalization and solubilization of polycyclic aromatic compounds by sulfoniumization.Chem Sci. 2025 Apr 11;16(19):8262-8267. doi: 10.1039/d5sc01415h. eCollection 2025 May 14. Chem Sci. 2025. PMID: 40271021 Free PMC article.
-
Highly adaptable deep-learning platform for automated detection and analysis of vesicle exocytosis.Nat Commun. 2025 Jul 12;16(1):6450. doi: 10.1038/s41467-025-61579-3. Nat Commun. 2025. PMID: 40651941 Free PMC article.
-
Role of Oxygen Defects in Eliciting a Divergent Fluorescence Response of Single-Walled Carbon Nanotubes to Dopamine and Serotonin.ACS Nano. 2024 Dec 17;18(50):34134-34146. doi: 10.1021/acsnano.4c10360. Epub 2024 Dec 4. ACS Nano. 2024. PMID: 39632591 Free PMC article.
-
Interactional Fingerprints Offer Accessible, Rapid, and Qualitative Characterization of Graphene Oxide.J Am Chem Soc. 2025 Jul 23;147(29):25471-25477. doi: 10.1021/jacs.5c05355. Epub 2025 Jul 9. J Am Chem Soc. 2025. PMID: 40633108 Free PMC article.
References
-
- Weisman R. B.Fluorescence Spectroscopy of Single-Walled Carbon Nanotubes. Applied Physics of Carbon Nanotubes; Rotkin S. V., Subramoney S., Eds.; Springer, 2005; pp 183–202.10.1007/3-540-28075-8_7. - DOI
-
- Schöppler F.; et al. Molar Extinction Coefficient of Single-Wall Carbon Nanotubes. J. Phys. Chem. C 2011, 115, 14682–14686. 10.1021/jp205289h. - DOI
Publication types
MeSH terms
Substances
LinkOut - more resources
Full Text Sources
