. 2024 Mar 13;147(1):56.
doi: 10.1007/s00401-024-02688-z.

Neuronal STING activation in amyotrophic lateral sclerosis and frontotemporal dementia

Affiliations

Neuronal STING activation in amyotrophic lateral sclerosis and frontotemporal dementia

Christine Marques et al. Acta Neuropathol. .

Abstract

The stimulator of interferon genes (STING) pathway has been implicated in neurodegenerative diseases, including Parkinson's disease and amyotrophic lateral sclerosis (ALS). While prior studies have focused on STING within immune cells, little is known about STING within neurons. Here, we document neuronal activation of the STING pathway in human postmortem cortical and spinal motor neurons from individuals affected by familial or sporadic ALS. This process takes place selectively in the most vulnerable cortical and spinal motor neurons but not in neurons that are less affected by the disease. Concordant STING activation in layer V cortical motor neurons occurs in a mouse model of C9orf72 repeat-associated ALS and frontotemporal dementia (FTD). To establish that STING activation occurs in a neuron-autonomous manner, we demonstrate the integrity of the STING signaling pathway, including both upstream activators and downstream innate immune response effectors, in dissociated mouse cortical neurons and neurons derived from control human induced pluripotent stem cells (iPSCs). Human iPSC-derived neurons harboring different familial ALS-causing mutations exhibit increased STING signaling with DNA damage as a main driver. The elevated downstream inflammatory markers present in ALS iPSC-derived neurons can be suppressed with a STING inhibitor. Our results reveal an immunophenotype that consists of innate immune signaling driven by the STING pathway and occurs specifically within vulnerable neurons in ALS/FTD.

Keywords: Amyotrophic lateral sclerosis; Central neurons; DNA damage; Motor neuron disease; Neuroinflammation; STING.


Conflict of interest statement

The authors declare the following competing interests. B.T.H. has a family member who works at Novartis and owns stock in Novartis; he serves on the SAB of Dewpoint and owns stock. He serves on a scientific advisory board or is a consultant for AbbVie, Aprinoia Therapeutics, Arvinas, Avrobio, Axial, Biogen, BMS, Cure Alz Fund, Cell Signaling, Eisai, Genentech, Ionis, Latus, Novartis, Sangamo, Sanofi, Seer, Takeda, the US Dept. of Justice, Vigil, and Voyager. His laboratory is supported by research grants from the National Institutes of Health, Cure Alzheimer’s Fund, Tau Consortium, and the JPB Foundation and sponsored research agreements from Abbvie, BMS, and Biogen. L.P. and Mayo Clinic have licensed technology involving C9orf72 repeat expansion constructs and a virus and AAV-C9orf72-149 repeat expansion mouse model. L.P. is a consultant for Expansion Therapeutics. M.W.A. owns shares and is on the scientific advisory board of Aromha, Inc. He serves on the scientific advisory board of Sudo Therapeutics and is a consultant for BMS and Transposon. C.L.T. serves as a scientific advisory board member or is a consultant for Arbor Biotechnology, Dewpoint Therapeutics, Libra Therapeutics, Mitsubishi Tanabe Pharma Corporation, Sanofi, and SOLA Biosciences. B.J.W. serves as a scientific advisory board member and a consultant for Quralis and is a consultant for Apic Bio, Q-State Biosciences, Takeda, and Sanofi. The remaining authors declare no competing interests.

Figures

Fig. 1
Fig. 1
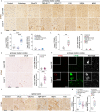
STING accumulates in layer V CRYM-positive cortical pyramidal neurons in the postmortem motor cortex and SMNs from multiple fALS and sALS variants. a Immunoperoxidase staining showing STING protein in layer II/III (upper panels) and layer V (lower panels) pyramidal neurons from matched non-neurological control, AD, C9orf72, as well as several additional fALS (mutations in TDP-43, PFN1, FUS, KIF5A, and NEK1) motor cortex brain sections. Bottom left inset in each picture shows high-magnification view of STING signal including in cell body and apical dendrite of layer V pyramidal neurons (bottom row). b, c Boxplots depicting the number of layer II/III and layer V STING-positive cortical pyramidal neurons in the motor cortex of C9orf72 (3 FTD/ALS dark blue dots and 5 ALS light blue dots) compared to AD (n = 8, purple) and matched non-neurological control (n = 5, gray) brains (b) and other fALS mutations (n = 6, colored as indicated) compared to separate additional matched non-neurological control brains (n = 4, gray) (c). Each dot represents an individual. d Left, immunoperoxidase staining showing STING protein in layer II/III and layer V pyramidal neurons from the motor cortex of sALS and separate additional matched non-neurological control brains. Right, boxplots depicting the number of layer II/III and layer V STING-positive cortical pyramidal neurons in the motor cortex of sALS (n = 12, purple) compared to non-neurological control (n = 6, gray) brains. (e) Representative immunofluorescence images from C9orf72 brains for neurons (HUC/HUD, white), CRYM (green), and STING (red). f Immunoperoxidase staining showing STING protein in ventral spinal cord SMNs from C9orf72, sALS, and additional fALS cases (TDP-43, FUS, NEK1) and matched non-neurological controls. g Boxplots depicting the number of STING-positive SMNs in C9orf72 (three FTD/ALS dark blue dots and three ALS light blue dots) and sALS (n = 12, purple) compared to matched non-neurological controls (n = 6, gray) and other fALS mutations (n = 4, colored as indicated) compared to separate additional matched non-neurological controls (n = 3). Scale bars = 100 μm and 40 μm for insets. All data are shown as mean ± s.e.m (boxplots), unpaired two-tailed Student’s t test: p < 0.05*; p < 0.01 **; p < 0.001 ***
Fig. 2
Fig. 2
STING signaling is increased in deep layer V neurons in C9orf72 mouse model. a Representative images of layer V CTIP2-positive cortical pyramidal neurons (white) in the motor cortex of 1-year-old mice expressing 149 G4C2-repeats ((G4C2)149, three males, two females) compared to 2 G4C2-repeats control ((G4C2)2, two males, two females). b Boxplot depicting the number of layer V CTIP2-positive neurons in (G4C2)2 (gray) and (G4C2)149 (orange) mice. c Immunostaining for STING (green), CTIP2 (magenta), and DAPI (blue) in layer II/III (above) and layer V (below) in the motor cortex of (G4C2)2 control and (G4C2)149 mice. Representative images for layer II/III and layer V are from the same motor cortex tissue sections. Bottom right inset in each image shows high-magnification view. d Boxplot represents the percentage (%) of layer V CTIP2-positive neurons that were also STING-positive (dual CTIP2+, STING+) in (G4C2)149 mice compared (G4C2)2 to mice. e Representative images showing cytoplasmic STING (green) and adjacent downstream marker p-IRF3 (red) in the nucleus. Each dot in boxplots represents a mouse (n = 4–5 per group). Scale bars = 50 μm and 10 μm for insets. All data are shown as mean ± s.e.m, unpaired two-tailed Student’s t test: p < 0.05*; p < 0.01 **; p < 0.001 ***
Fig. 3
Fig. 3
STING pathway is present and functional within primary mouse cortical neurons. a Left, immunofluorescence staining of canonical p-IRF3 and non-canonical p-NF-κB effectors and their upstream regulator STING protein in primary mouse cortical neurons treated with mouse STING agonist DMXAA (20 μg/ml, 1 h) compared to vehicle control. Neuron-specific class III β-tubulin (TUJ1, white) and DAPI staining (blue) demarcate neurons and cell nuclei, respectively. Right, quantification of nuclear p-IRF3 (upper panel), nuclear p-NF-κB (middle panel), and cytoplasmic STING areas in primary mouse cortical neurons treated with vehicle control (gray) and DMXAA (blue). Each object represents a well, and each symbol represents an independent differentiation (triangles, squares, circles, and crosses). b RT-qPCR analysis of the RNA expression of canonical IRF3 (above), non-canonical NF-κB response cytokines (middle), and STING (below) in primary mouse cortical neurons treated (3 h) with vehicle control (gray), DMXAA (blue, 20 μg/ml), or with STING blockers H151 (red, 1 μM) and RU.521 (orange, 10 μM). Each dot represents an independent experiment (n = 3). Scale bar = 10 μm. Data are shown as mean ± s.e.m, unpaired two-tailed Student’s t test: p < 0.05*; p < 0.01 **; p < 0.001 ***
Fig. 4
Fig. 4
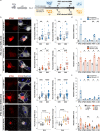
STING pathway is activated in a range of human ALS iPSC-derived neurons in the absence of exogenous stressors. a Schematic for iPSC-derived small-molecule SMN differentiation and NGN2 transcription factor (TF)-based induction. b Left, immunofluorescence staining for STING (red), TUJ1 (white), and DAPI (blue) in iPSC-derived small-molecule SMNs at day 35 of differentiation (D35) from isoTDP-43+/+ control compared to isoTDP-43+/G298S (upper panels) and healthy control 11a compared to C9orf72 19f SMNs (lower panels). Right, quantification of time-dependent changes in cytoplasmic STING area and STING intensity in isoTDP-43+/+ (gray) compared to isoTDP-43+/G298S (blue) (above) and healthy control (11a, dark gray) compared to C9orf72 (19f, orange) (below) SMNs. c Left, staining for STING (red), TUJ1 (white), and DAPI (blue) in iPSC-derived TF NGN2 neurons at day 10 of differentiation (D10) from isoTDP-43+/+ compared to isoTDP-43+/G298S (upper panels) and healthy control (FA10) compared to C9orf72 (ND74) (lower panels) NGN2 neurons. Right, quantification of time-dependent changes in cytoplasmic STING area and STING intensity in isoTDP-43+/+ (gray) compared to isoTDP-43+/G298S (blue) (above) and healthy controls (gradient of gray: light, FA10, medium, Kolf2.1; dark, 11a) compared to C9orf72 (yellow, ND74; orange, ND76; red, ND80) (below) NGN2 neurons. d RT-qPCR analysis showing increase of canonical IRF3 (IFNA, IFNB1, ISG54) and non-canonical NF-κB (TNFA, IL1B response genes in isoTDP-43+/+ (gray) compared to isoTDP-43+/G298S (blue) (above) and healthy control (11a, dark gray) compared to C9orf72 (19f, orange) (below) SMNs at day 35. e RT-qPCR analysis of downstream canonical IRF3 and non-canonical NF-κB response genes in isoTDP-43+/+ (gray) compared to isoTDP-43+/G298S (blue) at day 30 (above) and healthy control (gray, same three indicated lines) compared to C9orf72 (orange, same three indicated lines) (below) NGN2 neurons at day 10. b, c Each object represents a well, and each symbol represents an independent differentiation (triangles, squares, and circles). d, e Each dot represents an independent differentiation (n = 3–4). Scale bar = 10 μm. All data are shown as mean ± s.e.m, unpaired two-tailed Student’s t test: p < 0.05*; p < 0.01 **; p < 0.001 ***; p < 0.0001 ****
Fig. 5
Fig. 5
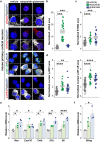
DNA damage induction upon etoposide or glutamate treatment yields γH2AX and STING pathway activation in primary mouse cortical neurons. a Representative immunofluorescence staining of γH2AX (red), STING protein (red) and downstream effectors, p-IRF3 (red), and p-NF-κB (green) in primary mouse cortical neurons after 1 h treatment with either vehicle, DNA damage stressors etoposide (5 μM) or glutamate (10 μM). Cell nuclei and neuronal cytoplasm are demarcated by DAPI (blue) and TUJ1 staining (white), respectively. b-d Quantification of nuclear γH2AX area (b), cytoplasmic STING area (c), and downstream effectors, nuclear p-IRF3 (d, left) and p-NF-κB (d, right). e RT-qPCR analysis of downstream inflammatory-response genes following vehicle (gray), etoposide (green), and glutamate (blue) after 3 h treatments as above. f RT-qPCR analysis of Sting expression in response to vehicle (gray), etoposide (green), and glutamate (blue) treatment (3 h). b, c, d Each object represents a well, and each symbol represents an independent experiment (triangles, squares, circles, and crosses). e, f Each dot represents an independent experiment (n = 3). Scale bar = 10 μm. All data are shown as mean ± s.e.m, unpaired two-tailed Student’s t test: p < 0.05*; p < 0.01 **; p < 0.001 ***; p < 0.0001 ****
Fig. 6
Fig. 6
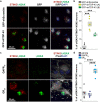
TDP-43 depletion and C9orf72 DPR treatment each elicits DNA damage and STING pathway activation in iPSC-derived neurons. a Representative immunofluorescence images of DNA damage (γH2AX, green) and STING (red) in control iPSC-derived NGN2 neurons treated with GFP-shRNA-TDP-43 for 48 h compared to GFP-shRNA-Scramble (GFP, white). b Quantification of dual DNA damage γH2AX-positive and STING-positive NGN2 neurons following treatment with either of two shRNA-TDP-43 constructs (yellow GFP-shTDP-43 (A); green GFP-shTDP-43 (B)) compared to scrambled shRNA (gray GFP-shScramble). Each object represents a well, and each symbol represents an independent experiment (circles, triangles). c Representative immunofluorescence images of γH2AX (green), STING protein (red), TUJ1 (white), and DAPI (blue) in control iPSC-derived NGN2 neurons after 24 h treatment with (GR)20 dipeptide repeat compared to (GAPR)10 dipeptide repeat control (1.25 μM). d Quantification of dual DNA damage γH2AX + and STING + NGN2 neurons following treatment with (GR)20 compared to control (GAPR)10 and an additional DMSO vehicle control. Each object represents a well, and each symbol represents an independent experiment (circles, triangles). Scale bar = 20 μm. All data are shown as mean ± s.e.m (boxplot b, d), unpaired two-tailed Student’s t test: p < 0.05*; p < 0.01 **; p < 0.001 ***, p < 0.0001 ****
Fig. 7
Fig. 7
Enhanced inflammatory response in ALS iPSC-derived neurons is suppressed by STING pathway inhibition. RT-qPCR analysis of the expression of non-canonical NF-κB (TNFA, IL1B) and canonical IRF3 (ISG54, IFNB1, IFNA) target genes in (a) isoTDP-43+/+ control (gray) compared to isoTDP-43+/G298S (blue) and in (b) healthy controls (gradient of gray: light, FA10, medium, Kolf2.1; dark, 11a) compared to C9orf72 (yellow, ND74; orange, ND76; red, ND80) NGN2 neurons treated for 24 h with vehicle control, or with STING blockers H151 (1 μM) and RU.521 (10 μM). Each dot represents an independent differentiation (n = 5 for TDP isogenic pair in (a), and n = 3 for C9orf72 and controls in (b)). All data are shown as mean ± s.e.m, unpaired two-tailed Student’s t test: p < 0.05*; p < 0.01 **; p < 0.001 ***

References

    1. Abo-Rady M, Kalmbach N, Pal A, Schludi C, Janosch A, Richter T, Freitag P, Bickle M, Kahlert AK, Petri S, et al. Knocking out C9ORF72 Exacerbates Axonal Trafficking Defects Associated with Hexanucleotide Repeat Expansion and Reduces Levels of Heat Shock Proteins. Stem Cell Reports. 2020;14:390–405. doi: 10.1016/j.stemcr.2020.01.010. - DOI - PMC - PubMed
    1. Andersen J, VanScoy S, Cheng TF, Gomez D, Reich NC. IRF-3-dependent and augmented target genes during viral infection. Genes Immun. 2008;9:168–175. doi: 10.1038/sj.gene.6364449. - DOI - PubMed
    1. Andrade NS, Ramic M, Esanov R, Liu W, Rybin MJ, Gaidosh G, Abdallah A, Del'Olio S, Huff TC, Chee NT, et al. Dipeptide repeat proteins inhibit homology-directed DNA double strand break repair in C9ORF72 ALS/FTD. Mol Neurodegener. 2020;15:13. doi: 10.1186/s13024-020-00365-9. - DOI - PMC - PubMed
    1. Arlotta P, Molyneaux BJ, Chen J, Inoue J, Kominami R, Macklis JD. Neuronal subtype-specific genes that control corticospinal motor neuron development in vivo. Neuron. 2005;45:207–221. doi: 10.1016/j.neuron.2004.12.036. - DOI - PubMed
    1. Bang J, Spina S, Miller BL. Frontotemporal dementia. Lancet. 2015;386:1672–1682. doi: 10.1016/S0140-6736(15)00461-4. - DOI - PMC - PubMed

Publication types

MeSH terms

Supplementary concepts