

In vivo evolution of antimicrobial resistance in a biofilm model of Pseudomonas aeruginosa lung infection
- PMID: 38478426
- PMCID: PMC10980832
- DOI: 10.1093/ismejo/wrae036
In vivo evolution of antimicrobial resistance in a biofilm model of Pseudomonas aeruginosa lung infection
Abstract
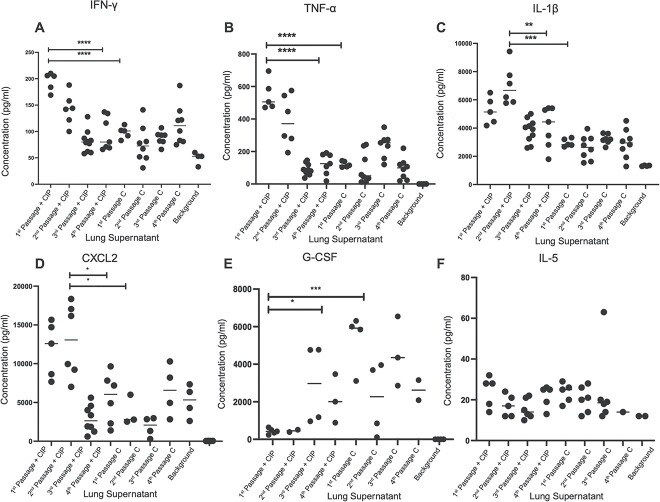
The evolution of antimicrobial resistance (AMR) in biofilms has been repeatedly studied by experimental evolution in vitro, but rarely in vivo. The complex microenvironment at the infection site imposes selective pressures on the bacterial biofilms, potentially influencing the development of AMR. We report here the development of AMR in an in vivo mouse model of Pseudomonas aeruginosa biofilm lung infection. The P. aeruginosa embedded in seaweed alginate beads underwent four successive lung infection passages with or without ciprofloxacin (CIP) exposure. The development of CIP resistance was assessed at each passage by population analysis of the bacterial populations recovered from the lungs of CIP-treated and control mice, with subsequent whole-genome sequencing of selected isolates. As inflammation plays a crucial role in shaping the microenvironment at the infection site, its impact was explored through the measurement of cytokine levels in the lung homogenate. A rapid development of AMR was observed starting from the second passage in the CIP-treated mice. Genetic analysis revealed mutations in nfxB, efflux pumps (mexZ), and two-component systems (parS) contribution to CIP resistance. The control group isolates exhibited mutations in the dipA gene, likely associated with biofilm dispersion. In the initial two passages, the CIP-treated group exhibited an elevated inflammatory response compared to the control group. This increase may potentially contribute to the release of mutagenic reactive oxygen species and the development of AMR. In conclusion, this study illustrates the complex relationship between infection, antibiotic treatment, and immune response.
Keywords: Pseudomonas aeruginosa; antimicrobial resistance; biofilm; in vivo evolution; inflammatory response.
© The Author(s) 2024. Published by Oxford University Press on behalf of the International Society for Microbial Ecology.
Conflict of interest statement
None declared.
Figures


Similar articles
-
The impact of antioxidant-ciprofloxacin combinations on the evolution of antibiotic resistance in Pseudomonas aeruginosa biofilms.NPJ Biofilms Microbiomes. 2024 Dec 30;10(1):156. doi: 10.1038/s41522-024-00640-3. NPJ Biofilms Microbiomes. 2024. PMID: 39738092 Free PMC article.
-
Lack of the Major Multifunctional Catalase KatA in Pseudomonas aeruginosa Accelerates Evolution of Antibiotic Resistance in Ciprofloxacin-Treated Biofilms.Antimicrob Agents Chemother. 2019 Sep 23;63(10):e00766-19. doi: 10.1128/AAC.00766-19. Print 2019 Oct. Antimicrob Agents Chemother. 2019. PMID: 31307984 Free PMC article.
-
Evolution of Antibiotic Resistance in Biofilm and Planktonic Pseudomonas aeruginosa Populations Exposed to Subinhibitory Levels of Ciprofloxacin.Antimicrob Agents Chemother. 2018 Jul 27;62(8):e00320-18. doi: 10.1128/AAC.00320-18. Print 2018 Aug. Antimicrob Agents Chemother. 2018. PMID: 29760140 Free PMC article.
-
Pseudomonas aeruginosa biofilms in cystic fibrosis.Future Microbiol. 2010 Nov;5(11):1663-74. doi: 10.2217/fmb.10.125. Future Microbiol. 2010. PMID: 21133688 Review.
-
Standard versus biofilm antimicrobial susceptibility testing to guide antibiotic therapy in cystic fibrosis.Cochrane Database Syst Rev. 2020 Jun 10;6(6):CD009528. doi: 10.1002/14651858.CD009528.pub5. Cochrane Database Syst Rev. 2020. PMID: 32520436 Free PMC article.
Cited by
-
Targeting efflux pumps prevents the multi-step evolution of high-level resistance to fluoroquinolone in Pseudomonas aeruginosa.Microbiol Spectr. 2025 Apr;13(4):e0298124. doi: 10.1128/spectrum.02981-24. Epub 2025 Feb 21. Microbiol Spectr. 2025. PMID: 39982069 Free PMC article.
-
Divergent molecular strategies drive evolutionary adaptation to competitive fitness in biofilm formation.ISME J. 2024 Jan 8;18(1):wrae135. doi: 10.1093/ismejo/wrae135. ISME J. 2024. PMID: 39052320 Free PMC article.
-
Diversification of Pseudomonas aeruginosa After Inhaled Tobramycin Therapy of Cystic Fibrosis Patients: Genotypic and Phenotypic Characteristics of Paired Pre- and Post-Treatment Isolates.Microorganisms. 2025 Mar 24;13(4):730. doi: 10.3390/microorganisms13040730. Microorganisms. 2025. PMID: 40284567 Free PMC article.
-
The impact of antioxidant-ciprofloxacin combinations on the evolution of antibiotic resistance in Pseudomonas aeruginosa biofilms.NPJ Biofilms Microbiomes. 2024 Dec 30;10(1):156. doi: 10.1038/s41522-024-00640-3. NPJ Biofilms Microbiomes. 2024. PMID: 39738092 Free PMC article.
References
-
- Ciofu O, Mandsberg LF, Bjarnsholt Tet al. . Genetic adaptation of Pseudomonas aeruginosa during chronic lung infection of patients with cystic fibrosis: strong and weak mutators with heterogeneous genetic backgrounds emerge in mucA and/or lasR mutants. Microbiology 2010;156:1108–19. 10.1099/mic.0.033993-0 - DOI - PubMed
MeSH terms
Substances
Grants and funding
LinkOut - more resources
Full Text Sources
Medical
Research Materials
Miscellaneous
