

Mathematical expansion and clinical application of chronic kidney disease stage as vector field
- PMID: 38478478
- PMCID: PMC10936765
- DOI: 10.1371/journal.pone.0297389
Mathematical expansion and clinical application of chronic kidney disease stage as vector field
Abstract
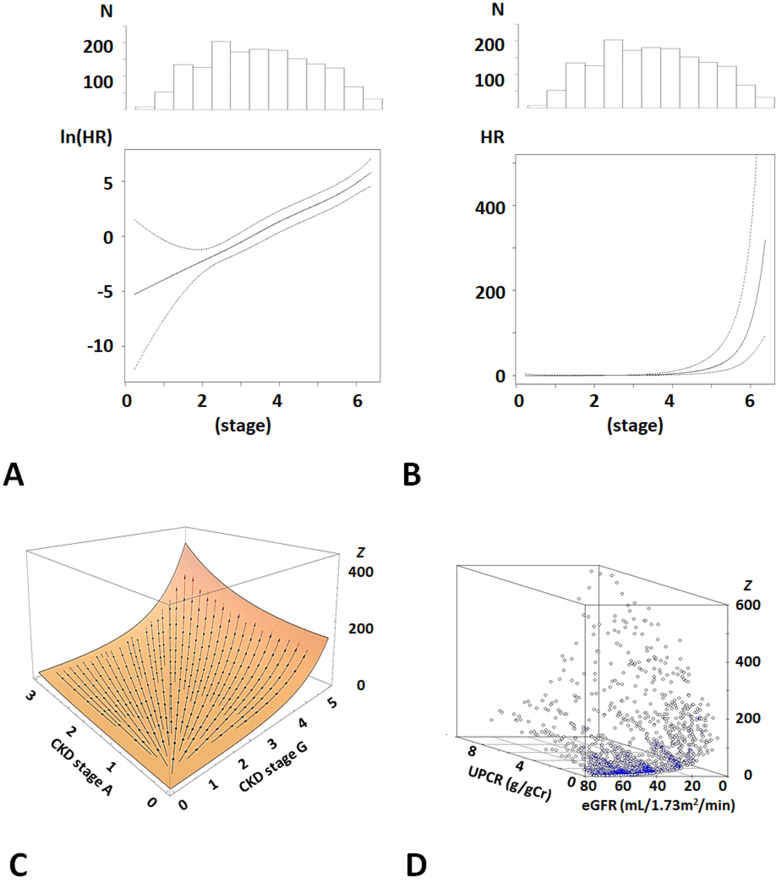
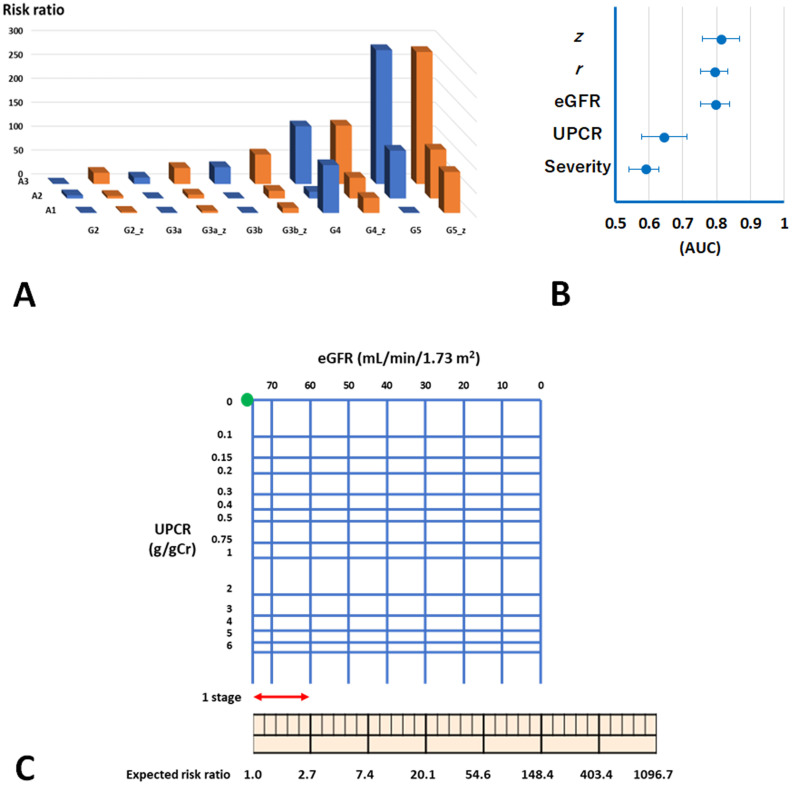
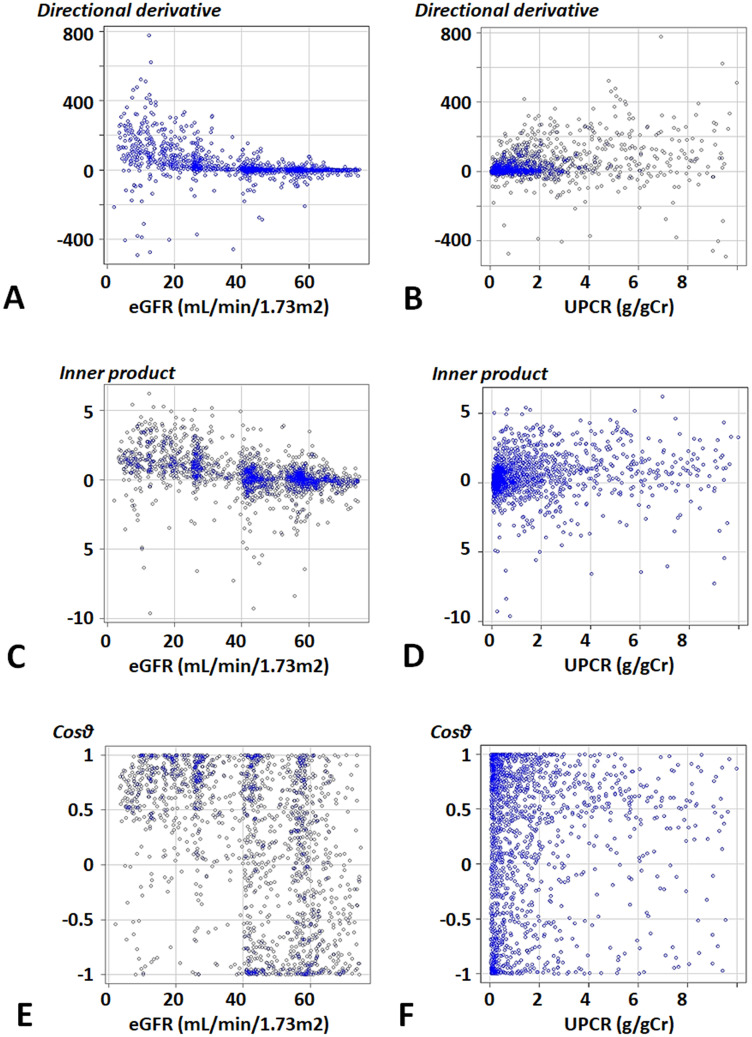
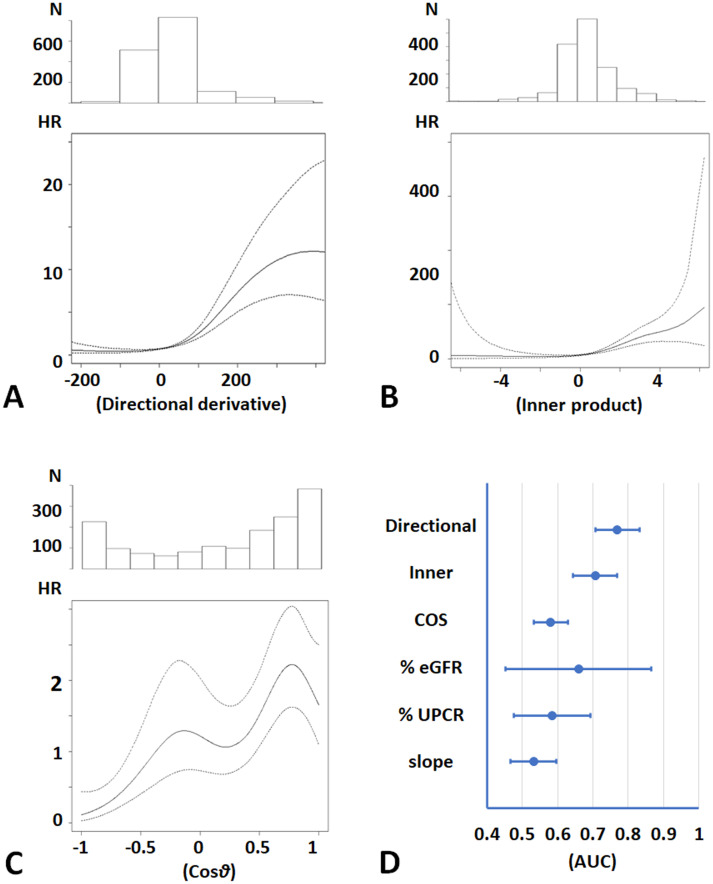
There are cases in which CKD progression is difficult to evaluate, because the changes in estimated glomerular filtration rate (eGFR) and proteinuria sometimes show opposite directions as CKD progresses. Indices and models that enable the easy and accurate risk prediction of end-stage-kidney disease (ESKD) are indispensable to CKD therapy. In this study, we investigated whether a CKD stage coordinate transformed into a vector field (CKD potential model) accurately predicts ESKD risk. Meta-analysis of large-scale cohort studies of CKD patients in PubMed was conducted to develop the model. The distance from CKD stage G2 A1 to a patient's data on eGFR and proteinuria was defined as r. We developed the CKD potential model on the basis of the data from the meta-analysis of three previous cohort studies: ESKD risk = exp(r). Then, the model was validated using data from a cohort study of CKD patients in Japan followed up for three years (n = 1,564). Moreover, the directional derivative of the model was developed as an index of CKD progression velocity. For ESKD prediction in three years, areas under the receiver operating characteristic curves (AUCs) were adjusted for baseline characteristics. Cox proportional hazards models with spline terms showed the exponential association between r and ESKD risk (p<0.0001). The CKD potential model more accurately predicted ESKD with an adjusted AUC of 0.81 (95% CI 0.76, 0.87) than eGFR (p<0.0001). Moreover, the directional derivative of the model showed a larger adjusted AUC for the prediction of ESKD than the percent eGFR change and eGFR slope (p<0.0001). Then, a chart of the transformed CKD stage was developed for implementation in clinical settings. This study indicated that the transformed CKD stage as a vector field enables the easy and accurate estimation of ESKD risk and CKD progression and suggested that vector analysis is a useful tool for clinical studies of CKD and its related diseases.
Copyright: © 2024 Kanda et al. This is an open access article distributed under the terms of the Creative Commons Attribution License, which permits unrestricted use, distribution, and reproduction in any medium, provided the original author and source are credited.
Conflict of interest statement
The authors have declared that no competing interests exist.
Figures
Similar articles
-
Risk of Progression of Nonalbuminuric CKD to End-Stage Kidney Disease in People With Diabetes: The CRIC (Chronic Renal Insufficiency Cohort) Study.Am J Kidney Dis. 2018 Nov;72(5):653-661. doi: 10.1053/j.ajkd.2018.02.364. Epub 2018 May 18. Am J Kidney Dis. 2018. PMID: 29784612
-
Sex Differences in the Progression of CKD Among Older Patients: Pooled Analysis of 4 Cohort Studies.Am J Kidney Dis. 2020 Jan;75(1):30-38. doi: 10.1053/j.ajkd.2019.05.019. Epub 2019 Aug 10. Am J Kidney Dis. 2020. PMID: 31409508
-
A Novel Kidney Failure Prediction Model in Individuals With CKD: Impact of Serum Bilirubin Levels.J Clin Endocrinol Metab. 2025 Apr 22;110(5):1375-1383. doi: 10.1210/clinem/dgae430. J Clin Endocrinol Metab. 2025. PMID: 38912790 Free PMC article.
-
Low protein diets for non-diabetic adults with chronic kidney disease.Cochrane Database Syst Rev. 2020 Oct 29;10(10):CD001892. doi: 10.1002/14651858.CD001892.pub5. Cochrane Database Syst Rev. 2020. PMID: 33118160 Free PMC article.
-
Potential Role and Limitations of Estimated Glomerular Filtration Rate Slope Assessment in Cardiovascular Trials: A Review.JAMA Cardiol. 2022 May 1;7(5):549-555. doi: 10.1001/jamacardio.2021.5151. JAMA Cardiol. 2022. PMID: 34985495 Review.
References
-
- Matsushita K, van der Velde M, Astor BC, Woodward M, Levey AS, de Jong PE, et al.. Association of estimated glomerular filtration rate and albuminuria with all-cause and cardiovascular mortality in general population cohorts: a collaborative meta-analysis. Lancet. 2010;375(9731):2073–81. S0140-6736(10)60674-5 [pii] doi: 10.1016/S0140-6736(10)60674-5 . - DOI - PMC - PubMed
-
- Astor BC, Matsushita K, Gansevoort RT, van der Velde M, Woodward M, Levey AS, et al.. Lower estimated glomerular filtration rate and higher albuminuria are associated with mortality and end-stage renal disease. A collaborative meta-analysis of kidney disease population cohorts. Kidney Int. 2011;79(12):1331–40. Epub 2011/02/02. doi: 10.1038/ki.2010.550 . - DOI - PMC - PubMed
-
- KDIGO. Clinical Practice Guideline for the Evaluation and Management of Chronic Kidney Disease. Kidney int. 2013;3(Supplements 1):1–150. - PubMed
Publication types
MeSH terms
LinkOut - more resources
Full Text Sources
Medical
Research Materials
Miscellaneous
