. 2024 Mar 7;9(8):e173712.
doi: 10.1172/jci.insight.173712.

A distinct tumor microenvironment makes anaplastic thyroid cancer more lethal but immunotherapy sensitive than papillary thyroid cancer

Affiliations

A distinct tumor microenvironment makes anaplastic thyroid cancer more lethal but immunotherapy sensitive than papillary thyroid cancer

Pei-Zhen Han et al. JCI Insight. .

Abstract

Both anaplastic thyroid cancer (ATC) and papillary thyroid cancer (PTC) originate from thyroid follicular epithelial cells, but ATC has a significantly worse prognosis and shows resistance to conventional therapies. However, clinical trials found that immunotherapy works better in ATC than late-stage PTC. Here, we used single-cell RNA sequencing (scRNA-Seq) to generate a single-cell atlas of thyroid cancer. Differences in ATC and PTC tumor microenvironment components (including malignant cells, stromal cells, and immune cells) leading to the polarized prognoses were identified. Intriguingly, we found that CXCL13+ T lymphocytes were enriched in ATC samples and might promote the development of early tertiary lymphoid structure (TLS). Last, murine experiments and scRNA-Seq analysis of a treated patient's tumor demonstrated that famitinib plus anti-PD-1 antibody could advance TLS in thyroid cancer. We displayed the cellular landscape of ATC and PTC, finding that CXCL13+ T cells and early TLS might make ATC more sensitive to immunotherapy.

Keywords: Immunotherapy; Oncology; Thyroid disease.


Figures
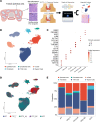
Figure 1
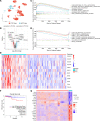
Figure 1. Overview of the TME in PTC and ATC at single-cell resolution.
(A) Workflow of the sample collection and analysis process of the present study. (B) Uniform manifold approximation and projection (UMAP) plot of the quantified 226,066 cells categorized into 6 major clusters. (C) The expression of classic markers for each major cell lineage. (D) UMAP plot of the quantified cells colored by tissue type. PT, para-tumor; PTC_T, primary tumor of PTC; PTC_LN, lymph node metastasis of PTC; PTC_SC, subcutaneous loci of PTC; ATC, primary tumor of ATC. (E) Bar plot showing the percentage of each major cell lineage in different types of tissues.
Figure 2
Figure 2. Distinct molecular features of ATC-Epis might contribute to the progression of ATC.
(A) UMAP plot revealed 2 major subclusters of Epis from thyroid cancer: ATC-Epis and PTC-Epis. (B) Volcano plot showing the differentially expressed genes (DEGs) between ATC-Epis and PTC-Epis. Diff.pct, different percentage. (C and D) GSEA results of DEGs between ATC-Epis and PTC-Epis. (E) Heatmap of the 12-gene signature expression in public microarray data sets of PTC and ATC. (F) The 12-gene signature could predict poor clinical outcomes in TCGA-THCA cohort. (G) Heatmap of key transcription factors of ATC-Epis and PTC-Epis.
Figure 3
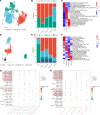
Figure 3. Tumor stromal dynamics of ATC and PTC.
(A) UMAP plot depicting 3 clusters of cancer-associated fibroblasts (CAFs) in ATC and PTC. (B) Bar plot showing the percentage of each CAF subcluster in different types of tissues. (C) Heatmap of GSVA results of upregulated genes of 3 CAF subclusters. (D) UMAP plot depicting 4 clusters of endothelial cells (ECs) in ATC and PTC. (E) Bar plot showing the percentage of each CAF subcluster in different types of tissues. (F) Heatmap of GSVA results of upregulated genes of 4 EC subclusters. (G) Different cell-cell interaction patterns between Epis or stromal cells and tip_EC in ATC and PTC samples. Key ligand-receptor (L-R) pairs are highlighted with red boxes. Commun. Prob., communication probability. (H) Bubble plot showing the potential L-R pairs between epithelial cells or stromal cells and ATC-CAFs. Key L-R pairs are highlighted with red boxes.
Figure 4
Figure 4. Multiple kinds of immune cells form a more immunosuppressive phenotype in ATC than in PTC.
(A) UMAP plot depicting 12 subgroups of T and NK lymphocytes from ATC and PTC samples. (B) Heatmap of the expression of canonical functional markers among 12 kinds of T or NK cells. (C) Trajectory analysis revealed distinct cell states of CD8+ T cells from ATC and PTC samples. (D) Correlation between calculated Exhaustion_Score and Component 1. T lymphocytes were stained according to their tissue origin. (E) M1 and M2 scores of macrophages from different tissues. (F) Heatmap of GSVA results of upregulated genes in macrophages from different tissues. (G) Violin plots of key DC-related biomarker expression in LAMP3-DCs derived from PT, PTC, and ATC samples.
Figure 5
Figure 5. Existence of CXCL13+ exhausted T cells in ATC tumors.
(A) Tissue preference of different immune cell subclusters evaluated by R/oe. (B and C) PDCD1 and PD-L1 expression in the tumor immune microenvironment of PTC (B) and ATC (C). (D) Volcano plot of DEGs between ATC-derived CD4_Th cells and PTC-derived CD4_Th cells. CXCL13 was upregulated in ATC-derived cells. (E) Volcano plot of DEGs between ATC-derived CD8_Tex cells and PTC-derived CD8_Tex cells. CXCL13 was upregulated in ATC-derived cells. (F and G) Dot plots of CXCL13 expression in CD4_Th (F) or CD8_Tex (G) cells from different patients. Patients who contained fewer than 50 single cells that were identified as CD4_Th or CD8_Tex were removed from these plots. (H and I) In the CD4_Th (H) or CD8_Tex (I) subpopulation, the percentage of CXCL13+ cells was significantly higher in ATC primary tumors than in PTC primary tumors. Box plots show the interquartile range, median (line), and minimum and maximum (whiskers). Statistical analysis: Student’s 2-tailed t test (*: P < 0.05, **: P < 0.01, ***: P < 0.001). (J) Representative mIHC image showing the coexpression of CD4 (CD4+ T cells, white) and CXCL13 (green) in an ATC section, with nuclei stained by DAPI (blue). CD4+CXCL13+ T lymphocytes are marked by red arrows. (K) Representative mIHC picture showing coexpression of CD8 (CD8+ T cell, red) and CXCL13 (green) in an ATC section, with nuclei stained by DAPI (blue). CD8+CXCL13+ T lymphocytes are marked by red arrows. Scale bar: 20 μm. Original magnification: left: 150×; right: 300×.
Figure 6
Figure 6. Potential early TLSs characterized in ATC samples.
(A) Different cell-cell interactions between GC B cells and immune cell subclusters between ATC and PTC. A key L-R pair (CXCL13-CXCR5) was identified between CD4_Th, or CD8_Tex, and GC B cells in ATC but not in PTC. (B) Lymphotoxin signaling cell-cell communication was upregulated in ATC. (C) Adhesion molecule–involved cell-cell communications were upregulated in ATC. (D) Heatmap of previously reported TLS signature scores in public ATC and PTC microarray data. (E) Representative mIHC image showing the coexpression of CD4 (CD4+ T cells, white), CD8 (CD8+ T cells, red), CD20 (B cells, yellow), and CXCL13 (green) in early TLSs in an ATC section. CXCL13+ T lymphocytes are marked by red arrows. Scale bar: 50 μm. Original magnification: left: 100×; right: 25×.
Figure 7
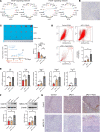
Figure 7. Famitinib plus immunotherapy could improve the antitumor effect in a murine thyroid cancer model by creating a pro-TLS microenvironment.
(A) VEGF signaling and PDGF signaling cell-cell communications were upregulated in ATC rather than PTC and involved with ECs. (B) IHC image showed nearly negative expression of the HEV marker (MECA-79) around the early TLSs identified in Figure 6E. Scale bar: 50 μm. (C) Tumor images, growth curve, and weight of the control group, anti–PD-1 (aPD-1) group, and famitinib plus aPD-1 (aPD-1+Fami) group of BPC xenografts. Statistical analysis: 1-way ANOVA followed by 2-stage step-up method of Benjamini, Krieger, and Yekutieli FDR procedure (*: q < 0.05, **: q < 0.001, ***: q < 0.001). n = 6 per group. (D) Representative flow cytometry images of each group of xenografts and the bar plot show an increase in infiltrated CD19+ B cells in the aPD-1+Fami group. Statistical analysis: 1-way ANOVA followed by Tukey multiple-comparison test or Kruskal-Wallis test followed by Dunn’s multiple comparisons test (*: P < 0.05). n = 3 per group. (E) QPCR results indicated higher mRNA expression of biomarkers related to TLS development in the aPD-1+Fami group (Ltb, Ltbr, Icam1, Vcam1, and Cxcl13). Statistical analysis: 1-way ANOVA followed by Tukey multiple-comparison test (*: P < 0.05, **: P < 0.01). n = 3 per group. (F) Western blot images and histograms suggested upregulation of Cxcl13 and MECA-79 in the aPD-1+Fami group. Statistical analysis: 1-way ANOVA followed by Tukey multiple-comparison test (*: P < 0.05). n = 3 per group. (G) Representative IHC staining of Cxcl13 and MECA-79 showed that both markers were upregulated in the aPD-1+Fami group. Scale bar: 50 μm.
Figure 8
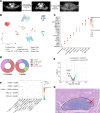
Figure 8. The pro-TLS cellular landscape of a patient with ATC treated with famitinib plus camrelizumab.
(A) Neck CT and MRI images of a woman with ATC (A37) receiving famitinib + camrelizumab therapy and surgery at different time points during her treatment. The primary thyroid tumor is marked by a red arrow. RAF, right anterior foot; LPH, left posterior head. (B) UMAP plot of cells from the famitinib + camrelizumab-treated patient showed 10 major cell lineages. (C) Bubble plot of marker genes of each cell cluster. (D) Pie charts of immune components of untreated and treated patients with ATC showed an increased percentage of B lymphocytes (B cells, plasma cells, and GC B cells) in treated patients. (E) Volcano plots of DEGs between CXCL13-high T cells from treated patients (T Cells-C1) and untreated patients (CD4_Th and CD8_Tex). (F) Cell-cell communication pattern of TLS-related signaling between CXCL13-high T cells (T Cells-C1) and other cell clusters in the treated patient. (G) HE staining image suggested TLS development in a patient with ATC treated with famitinib + camrelizumab. Scale bar: 200 µm.

Similar articles

Cited by

References

    1. Sung H, et al. Global cancer statistics 2020: GLOBOCAN estimates of incidence and mortality worldwide for 36 cancers in 185 countries. CA Cancer J Clin. 2021;71(3):209–249. doi: 10.3322/caac.21660. - DOI - PubMed
    1. Miranda-Filho A, et al. Thyroid cancer incidence trends by histology in 25 countries: a population-based study. Lancet Diabetes Endocrinol. 2021;9(4):225–234. doi: 10.1016/S2213-8587(21)00027-9. - DOI - PubMed
    1. Maniakas A, et al. Evaluation of overall survival in patients with anaplastic thyroid carcinoma, 2000-2019. JAMA Oncol. 2020;6(9):1397–1404. doi: 10.1001/jamaoncol.2020.3362. - DOI - PMC - PubMed
    1. Saini S, et al. Therapeutic advances in anaplastic thyroid cancer: a current perspective. Mol Cancer. 2018;17(1):154. doi: 10.1186/s12943-018-0903-0. - DOI - PMC - PubMed
    1. Ohaegbulam KC, et al. Human cancer immunotherapy with antibodies to the PD-1 and PD-L1 pathway. Trends Mol Med. 2015;21(1):24–33. doi: 10.1016/j.molmed.2014.10.009. - DOI - PMC - PubMed

Publication types

MeSH terms