. 2024 Mar 15;10(11):eadk0785.
doi: 10.1126/sciadv.adk0785. Epub 2024 Mar 13.

MLL1 regulates cytokine-driven cell migration and metastasis

Affiliations

MLL1 regulates cytokine-driven cell migration and metastasis

Praful R Nair et al. Sci Adv. .

Abstract

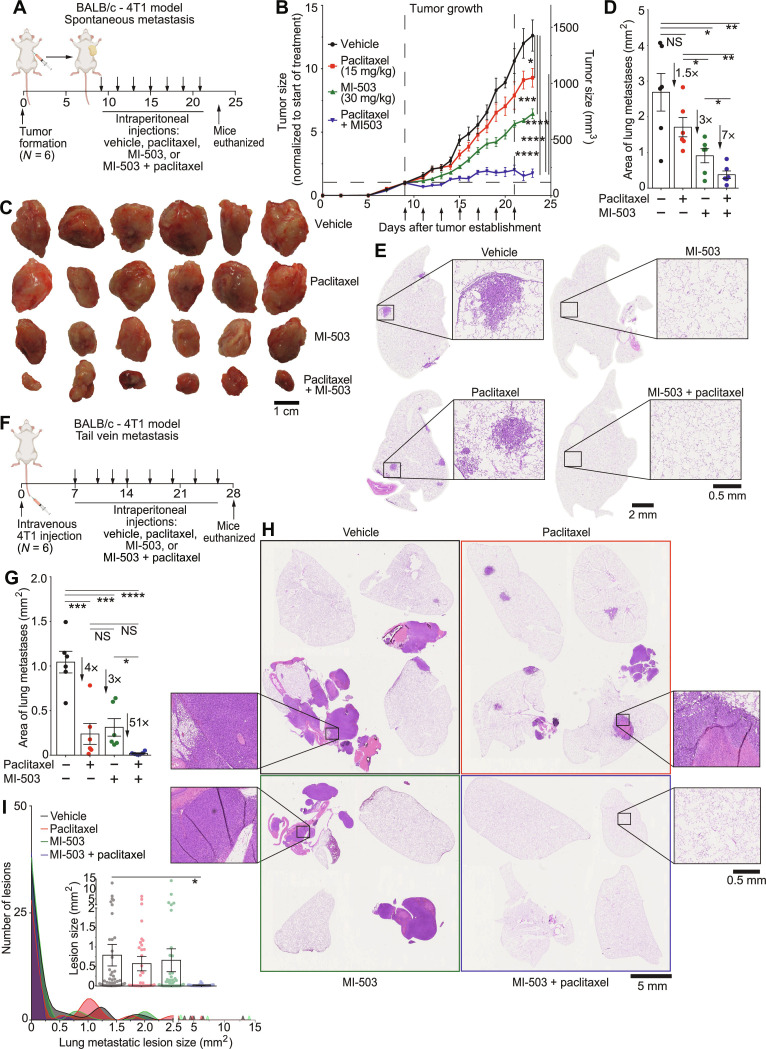
Cell migration is a critical contributor to metastasis. Cytokine production and its role in cancer cell migration have been traditionally associated with immune cells. We find that the histone methyltransferase Mixed-Lineage Leukemia 1 (MLL1) controls 3D cell migration via cytokines, IL-6, IL-8, and TGF-β1, secreted by the cancer cells themselves. MLL1, with its scaffold protein Menin, controls actin filament assembly via the IL-6/8/pSTAT3/Arp3 axis and myosin contractility via the TGF-β1/Gli2/ROCK1/2/pMLC2 axis, which together regulate dynamic protrusion generation and 3D cell migration. MLL1 also regulates cell proliferation via mitosis-based and cell cycle-related pathways. Mice bearing orthotopic MLL1-depleted tumors exhibit decreased lung metastatic burden and longer survival. MLL1 depletion leads to lower metastatic burden even when controlling for the difference in primary tumor growth rates. Combining MLL1-Menin inhibitor with paclitaxel abrogates tumor growth and metastasis, including preexistent metastasis. These results establish MLL1 as a potent regulator of cell migration and highlight the potential of targeting MLL1 in patients with metastatic disease.


Figures

Fig. 1.
Fig. 1.. MLL1-Menin interaction regulates cancer cell migration, proliferation, and tumor progression.
(A) Epigenetic factors in the TCGA basal breast cancer (BRCA) were queried for correlation with cell migration genes. MLL1 was among the best correlated epigenetic factors. (B) Cells embedded in 3D collagen gels were tracked overnight using live-cell phase-contrast microscopy. Resulting videos were analyzed to obtain cell trajectories, velocity, and diffusivity using the anisotropic persistent random walk model (APRW) cell migration model. (C) shMLL1 cells exhibited shorter trajectories than scrambled nontargeting shRNA control and WT cells. (D) shMLL1 cells had lower velocity, compared to control cells. Each dot in the box-and-whisker plot corresponds to one cell. The limits of the box represent the 75th and 25th percentiles, and the center line represents the median. The whiskers stretch from the 1st to the 99th percentile. (E) Pharmacological inhibition of MLL1-Menin interaction inhibits cell migration. (F) MLL1 depletion decreases cell proliferation. (G) shMLL1 tumors grew slower compared to scrambled control tumors. (H) Mice bearing shMLL1 tumors survive longer than control tumors [median survival of 89 days versus 64 days, respectively, and hazard ratio (HR) of 0.20]. (I) H&E staining of lungs show lighter staining for mice bearing shMLL1tumors, indicative of lower metastatic burden compared to scrambled control tumors. (J) Quantification of total metastatic burden per lung showed decreased metastatic burden in mice bearing shMLL1 tumors. (K) Histogram of lesion size of representative lungs shows that decreased metastatic burden in shMLL1 lungs was due to reduced number of lesions and decreased lesion size. (L) RNA sequencing (RNA-seq) of MLL1-Menin–inhibited cells revealed down-regulation of cell migration and metastasis-related pathways including the IL-6–JAK–STAT3 and TGF-β signaling pathways. ES, enrichment score. Data in this figure were generated with MDA-MB-231 cells in vivo [(G) to (K)] or embedded in 3D collagen gels [(B) to (F) and (L)] except (A) (TCGA). (B) and (K) were created with BioRender. **P < 0.01, ***P < 0.001, and ****P < 0.0001. NS, not significant.
Fig. 2.
Fig. 2.. MLL1-Menin interaction regulates cell motility and protrusion generation via IL-6,8/pSTAT3 signaling.
(A) CM was collected from scrambled control cells and added to shMLL1 or scrambled control cells. CM addition fully rescued cell migration of shMLL1 cells as seen in (B) trajectories and (C) velocities. (D) MLL1-Menin inhibition leads to down-regulation of key genes in the IL-6/JAK/STAT3 signaling pathway. MLL1 i, MLL1 inhibitor. (E) shMLL1 cells showed down-regulation of IL-6/STAT3–regulated actin assembly pathway. (F) MLL1 inhibition reduces IL-6 secretion. (G) MLL1 inhibited cells show decreased protrusion generation, which can be rescued by supplementation of IL-6/8. (H) A temporal heatmap of protrusion-related parameters shows reduced cumulative number of protrusions and the maximum length of protrusion generated per cell following MLL1 inhibition. Each row is one cell, and each block is one condition. (I) Cell motility was rescued by supplementing cells with IL-6/8 on top of MLL1 inhibition (10 μM MI-2-2). Both IL-6 and IL-8 are necessary and sufficient to rescue migration despite continuing inhibition of the MLL1-Menin interaction, evident in (J) velocity and (K) trajectories. (L) pSTAT3, not STAT3, levels show loss and rescue following MLL1 inhibition and IL-6/8 supplementation, respectively. (M) Quantification of IL-6/8 rescues Western blots, and bands from same blot are connected by a line. (N and O) Arp2 and Arp3 show the same trend as pSTAT3 following MLL1 inhibition and IL-6/8 supplementation. (P) STAT3 knockdown reduces cell migration. (Q) Motility rescued in MLL1-inhibited cells via IL-6/8 supplementation was lost by inhibiting STAT3. (R) Schematic illustration of MLL1-Menin–based regulation of cell migration. MLL1-Menin interaction controls the production of IL-6/8, which leads to pSTAT3. pSTAT3 drives actin filament assembly via Arp2/3. All data in this figure were generated with MDA-MB-231 cells embedded in 3D collagen gels. (A) and (L) were created with BioRender. *P < 0.05, **P < 0.01, ***P < 0.001, and ****P < 0.0001. NS, not significant.
Fig. 3.
Fig. 3.. MLL1-Menin–based regulation of TGF-β1–mediated cell migration is mechanistically nonlinear.
(A) In contrast to 10 μM MI-2-2 treatment, supplementation of IL-6/8 did not rescue cell migration in 30 μM MI-2-2–treated cells, shown by cell velocities and (B) trajectories. MLL1 i, MLL1 inhibitor. (C) pMLC was down-regulated at a deep MLL1-Menin inhibition (30 μM MI-2-2), but not at lower doses (10 μM MI-2-2). ROCK inhibitor (Y-27632)–treated cells were the positive control. (D) Quantification of nonlinear response of myosin contractility to MLL1 inhibition in (C). (E) The newest MLL1-Menin inhibitors (MI-3454 and VTP50469) also reduced pMLC2. (F) Heatmap of gene expression values for the genes involved in Hallmark cell migration (in purple) or proliferation (in green) gene sets shows two distinct gene expression patterns corresponding to low (mode-1) and high (mode-2) MLL1-Menin inhibitor dosage. TGF-β family members (labeled in black) were down-regulated with deep MLL1-Menin inhibition. (G) ChIP-Atlas (an online ChIP-seq database)–based analysis reveals that MLL1, Menin, and WDR5 bind to the promoter region of TGFB1. COMPASS members also bound to NFKB1 and RELA promoter sequences. (H) MLL1 knockdown/depletion reduces expression of genes central to TGF-β signaling and myosin contractility. (I) Multiplex cytokine analysis showed that TGF-β1 levels were unaffected with low-dose MLL1 inhibition but were reduced with high dosage. N.D., not detected. (J) Immunofluorescence microscopy of MLL1-inhibited cells showed that MLL1-Menin inhibition reduces cell size, increases cell roundedness, and disrupts the actin cytoskeleton (red). Mode-2 MLL1 inhibition (30 μM MI-2-2) reduces pMLC2 (green), while mode-1 (10 μM MI-2-2)–treated cells still show pMLC2. Immunofluorescence quantification affirms these observations. Data in this figure were generated with MDA-MB-231 cells embedded in collagen gels except (G) (ChIP-Atlas) and (K) (MDA-MB-231 cells in 2D). *P < 0.05, **P < 0.01, ***P < 0.001, and ****P < 0.0001. NS, not significant.
Fig. 4.
Fig. 4.. MLL1-Menin interaction regulates myosin-based contractility via a Gli2/ROCK1/2/pMLC2 axis.
(A and B) Supplementation of TGF-β1 and IL-6/8 is necessary and sufficient to fully rescued cell migration in mode-2 MLL1-inhibited cells and (C) shMLL1 cells. MLL1 i, MLL1 inhibitor. (D) IL-6/8 + TGF-β1 rescued protrusion generation in MLL1-inhibited cells. (E and F) pMLC2 was rescued with supplementation of TGF-β1 (either by itself or concurrently with IL-6/8), indicating restoration of myosin contractility. NES, normalized enrichment score. (G and H) pSTAT3 was rescued by supplementation of IL-6/8 (either by itself or concurrently with TGF-β1). (I) GLI2 is the most down-regulated gene following MLL1-Menin inhibition. (J) Gli2, ROCK1, and ROCK2 levels were rescued by replenishment of TGF-β1, indicating that these lie downstream of both the MLL1-Menin interaction and TGF-β1. (K) shMLL1 cells expressed low levels of Gli2, pSTAT3, and Arp3; all of which were rescued by supplementation of TGF-β1 + IL-6/8. (L and M) Inhibition of Gli2, but not STAT3, reduced pMLC2, indicating that myosin contractility was regulated by TGF-β1/Gli2 signaling, rather than IL-6/8/STAT3 signaling. (N) Gli2 inhibition reduced levels of ROCK1/2, necessary for myosin contractility, indicating that TGF-β1– and Gli2-regulated myosin contractility was mediated by ROCK1/2. (O) Gli2 knockdown reduces cell migration. (P) Motility rescued by TGF-β1 + IL-6/8 supplementation after MLL inhibition (blue) is lost by inhibiting either Gli2 (downstream of TGF-β1) or STAT3 (downstream of IL-6/8). Concurrent inhibition of Gli2 and STAT3 led to the lowest cell motility. (Q) Expression of key genes implicated in MLL1-Menin–regulated cell migration is positively correlated with MLL1 expression in TCGA. (R) Deep (mode-2) MLL1-Menin inhibition disrupts motility in a two-pronged manner. MLL1-Menin interaction controls the production of IL-6/8, which regulates motility via STAT3/Arp2/3–mediated protrusion generation. In addition, MLL1-Menin interaction also regulates the production of TGF-β1, which controls myosin contractility via a Gli2/ROCK1/2/pMLC2 axis. Data in this figure were generated with MDA-MB-231 cells embedded in 3D collagen gels except (Q) (TCGA). *P < 0.05, **P < 0.01, ***P < 0.001, and ****P < 0.0001. NS, not significant.
Fig. 5.
Fig. 5.. MLL1-Menin regulates cell proliferation via a multitude of proliferation- and cell cycle–related pathways.
(A) MLL1-Menin inhibition with MI-2-2 or MI-503 results in a dose-dependent growth suppression. (B) Gene-gene correlation analysis on the 3926 Hallmark gene set genes that were expressed revealed three distinct modules (proliferation, inflammation, and migration) and a mixed module. Key cell cycle and proliferation genes were substantially enriched in modules 1 and 3. RNA-seq analysis of (C) shMLL1 cells versus scrambled control cells or (D) MLL1-Menin–inhibited cells shows down-regulation of several key proliferation- and cell cycle–related pathways and up-regulation of antiproliferative pathways. (E) GSEA enrichment plots of cell cycle–related pathways for mode-2 MLL1-inhibited cells (30 μM MI-2-2 treatment). (F) Volcano plot of mode-2 MLL1 inhibition (30 μM MI-2-2) versus untreated (DMSO) control shows nearly 4000 genes that are affected by MLL1-Menin inhibition (log2 fold change > 1 and P < 0.05, plotted in blue). These genes include those that have been implicated in our MLL1-Menin–based regulation of cell migration and proliferation (validation, in black). In addition, a subset of these genes consists of proliferation-related genes that further extend the scope of MLL1-Menin interaction in regulation of proliferation (discovery, in yellow). MLL1 i, MLL1 inhibitor. (G) PCA analysis on all conditions shows that lower doses of MLL1-Menin inhibitors (mode-1) cluster closer to the untreated control than to higher drug dosages. Each oval encompasses all technical replicates for that condition. All data in this figure were generated with MDA-MB-231 cells embedded in 3D collagen gels. *P < 0.05, **P < 0.01, and ***P < 0.001. NS, not significant.
Fig. 6.
Fig. 6.. MLL1-depleted cancer cells exhibit decreased lung metastases in vivo.
(A) Orthotopic breast tumors were established in nonobese diabetic–severe combined immunodeficient gamma (NSG) mice by injecting cells into mammary fat pad. Mice were euthanized upon reaching a set threshold size (1400 mm3). shMLL1 mice were euthanized ~3 weeks after control mice. (B) WT and scrambled control tumors grew faster than shMLL1 tumors. (C) This difference in growth rate is also illustrated in tumor sizes at day 40. (D) shMLL1 tumor–bearing mice showed reduced lung metastatic burden despite being euthanized later and at the same primary tumor size as scrambled control and WT tumors. (E) Quantification of total metastatic burden per lung shows a threefold reduction in shMLL1 lungs compared to scrambled control. (F) Histogram of metastatic lesions of representative lungs shows that the reduced metastatic burden in shMLL1 lungs was due to fewer metastatic lesions that were also smaller. (G) Extravasation and metastatic outgrowth were assessed using a tail vein metastasis model. Mice were euthanized 6 weeks after injection. (H) Mice injected with control (scrambled control or WT) cells showed numerous and large metastatic lesions, while shMLL1 lungs showed barely any lesions. (I) Quantification of total metastatic burden per lung shows more than a 20-fold decrease for shMLL1 lungs compared to scrambled control. (J) Histogram of metastatic lesions for the representative lungs shows a markedly reduced lesion size distribution for shMLL1 lungs compared to scrambled control or WT. (K) Representation of the role of MLL1 in the metastatic cascade. Three different in vivo studies have been used to elucidate the contribution of MLL1-Menin interaction in driving primary tumor growth (left), cancer cell migration and invasion (center), as well as extravasation and metastatic outgrowth (right). All data in this figure were generated with MDA-MB-231 cells in NSG mice. (A), (G), and (K) were created with BioRender. *P < 0.05, **P < 0.01, and ****P < 0.0001. NS, not significant.
Fig. 7.
Fig. 7.. Concurrent paclitaxel and MLL1-Menin inhibition arrests tumor growth and abrogates metastasis.
(A) BALB/c mice bearing syngeneic orthotopic 4T1 tumors were injected with a MLL1-Menin inhibitor (MI-503, 30 mg/kg), paclitaxel (15 mg/kg), a combination of the two drugs, or a vehicle intraperitoneally every alternate day for seven times. (B and C) The combination of MI-503 and paclitaxel was effective in reducing tumor growth, with the growth of combination-treated tumors being essentially arrested. This efficacy of combination treatment was reflected in final tumor sizes. (D) Quantification of metastatic burden per lung showed that MI-503 treatment reduced metastatic burden, while administration of paclitaxel alone did not produce a significant decrease. Combination treatment (MI-503 + paclitaxel) led to a sevenfold decrease in metastatic burden compared to vehicle control. (E) Sample lungs from each condition show large but limited metastases in vehicle- and paclitaxel-treated mice. MI-503 treated mice—alone or in conjunction with paclitaxel—showed no major metastatic foci in their lungs. (F) BALB/c mice were injected with 4T1 cells intravenously via a tail vein injection to form lung metastases. One week after injection, they were treated with MI-503 (30 mg/kg), paclitaxel (15 mg/kg), a combination of the two drugs, or a vehicle intraperitoneally every 3 days for eight times. Mice were euthanized 4 weeks after metastasis formation. (G) Quantification of total metastatic lung burden per mouse showed that combination treatment virtually eliminated metastatic burden. (H) Sample lungs show that paclitaxel or MLL1-Menin inhibition led to decreased metastatic burden compared to vehicle. However, the clearest lungs were obtained in combination-treated mice. (I) Histogram of metastatic lesions for representative lungs in (H) demonstrates a reduction in both size and number of lesions with paclitaxel treatment and/or MLL1 depletion. All data in this figure were generated with 4T1 cells in BALB/c mice. (A) and (F) were created with BioRender. *P < 0.05, **P < 0.01, ***P < 0.001, and ****P < 0.0001. NS, not significant.

Similar articles

Cited by

References

    1. Yamaguchi H., Wyckoff J., Condeelis J., Cell migration in tumors. Curr. Opin. Cell Biol. 17, 559–564 (2005). - PubMed
    1. Ganesh K., Massagué J., Targeting metastatic cancer. Nat. Med. 27, 34–44 (2021). - PMC - PubMed
    1. Jayatilaka H., Tyle P., Chen J. J., Kwak M., Ju J., Kim H. J., Lee J. S. H., Wu P.-H., Gilkes D. M., Fan R., Wirtz D., Synergistic IL-6 and IL-8 paracrine signalling pathway infers a strategy to inhibit tumour cell migration. Nat. Commun. 8, 15584 (2017). - PMC - PubMed
    1. Georgouli M., Herraiz C., Crosas-Molist E., Fanshawe B., Maiques O., Perdrix A., Pandya P., Rodriguez-Hernandez I., Ilieva K. M., Cantelli G., Karagiannis P., Mele S., Lam H., Josephs D. H., Matias-Guiu X., Marti R. M., Nestle F. O., Orgaz J. L., Malanchi I., Fruhwirth G. O., Karagiannis S. N., Sanz-Moreno V., Regional activation of myosin II in cancer cells drives tumor progression via a secretory cross-talk with the immune microenvironment. Cell 176, 757–774.e23 (2019). - PMC - PubMed
    1. Singh S., Singh U. P., Grizzle W. E., Lillard J. W., CXCL12-CXCR4 interactions modulate prostate cancer cell migration, metalloproteinase expression and invasion. Lab. Invest. 84, 1666–1676 (2004). - PubMed

Publication types