. 2024 Mar 15;10(11):eadm9518.
doi: 10.1126/sciadv.adm9518. Epub 2024 Mar 13.

Growth factor-induced activation of MSK2 leads to phosphorylation of H3K9me2S10 and corresponding changes in gene expression

Affiliations

Growth factor-induced activation of MSK2 leads to phosphorylation of H3K9me2S10 and corresponding changes in gene expression

Karen G Wong et al. Sci Adv. .

Abstract

Extracellular signals are transmitted through kinase cascades to modulate gene expression, but it remains unclear how epigenetic changes regulate this response. Here, we provide evidence that growth factor-stimulated changes in the transcript levels of many responsive genes are accompanied by increases in histone phosphorylation levels, specifically at histone H3 serine-10 when the adjacent lysine-9 is dimethylated (H3K9me2S10). Imaging and proteomic approaches show that epidermal growth factor (EGF) stimulation results in H3K9me2S10 phosphorylation, which occurs in genomic regions enriched for regulatory enhancers of EGF-responsive genes. We also demonstrate that the EGF-induced increase in H3K9me2S10ph is dependent on the nuclear kinase MSK2, and this subset of EGF-induced genes is dependent on MSK2 for transcription. Together, our work indicates that growth factor-induced changes in chromatin state can mediate the activation of downstream genes.


Figures

Fig. 1.
Fig. 1.. EGF stimulation leads to an increase in the cellular abundance of H3K9me2S10ph.
(A) Representative confocal images of cycling IMR90 cells immunostained for H3K9me2S10ph (green) and lamin B1 (red) and counterstained with DAPI (blue). Cells were treated with PBS (vehicle control) or EGF for 30 min. Scale bars, 25 μm. Dot plot shows normalized H3K9me2S10ph signal intensities. Lines show median values. n ≥ 564 cells per condition. (B) Representative confocal images of cycling IMR90 cells immunostained as in (A). Inset shows an individual nucleus of a cell in prophase (left) or metaphase (right). Scale bars, 25 and 5 μm. (C) Representative confocal images of serum-starved IMR90 cells treated with EGF for the indicated times; staining and quantification as in (A). n ≥ 140 cells per condition. Scale bars, 5 μm. (D and E) Representative Western blots of IMR90 cells treated with PBS or EGF for 30 min and probed for (D) H3K9me2S10ph or (E) H3S10ph and loading control (β-actin). (F and G) Quantifications of Western blots shown in (D) and (E). H3K9me2S10ph and H3S10ph signals, normalized to loading control (β-actin), and the mean of the signal in the PBS samples. Lines indicate mean ± SD. n = 18 (D) and 21 (E) biological replicates per condition. (H) Quantification using mass spectrometry of posttranslational modifications of the H3 tail from histones isolated from IMR90 cells treated with PBS or EGF for 30 min. n = 3 biological replicates. Statistical analyses performed using unpaired t test [(A), (F), (G), and (H)] or two-way analysis of variance (ANOVA) (C). ****P < 0.0001; *P < 0.05; ns, not significant.
Fig. 2.
Fig. 2.. EGF induction of H3K9me2S10ph is MSK2 dependent.
(A) Dot plot shows levels of H3K9me2S10ph measured by Western blots of serum-starved IMR90 cells treated with EGF or SB747651A compound (MSK inhibitor) as indicated. Measurements were normalized to loading control (β-actin) and the mean of the PBS sample. Lines indicate mean ± SD. n = 12 biological replicates per condition. Representative Western blots are shown below. (B) In vitro kinase assay in which active MSK1 or MSK2 was combined with ATP and recombinant nucleosomes with unmodified H3 tails (“None”) or dimethylated at Lys9 (“K9me2”). Immunoblots of each reaction were probed using antibodies to each histone modification as indicated. Schematic (left) created with BioRender. (C) Dot plot shows levels of H3K9me2S10ph measured by Western blots of serum-starved IMR90 cells treated with EGF and MSK1-targeting siRNA, as indicated. Measurements were normalized to loading control (β-actin) and the mean of the PBS sample. Lines indicate mean ± SD. n = 12 biological replicates per condition. Representative Western blots are shown below. (D) Dot plot shows levels of H3K9me2S10ph measured by Western blot from serum-starved IMR90 cells treated with EGF and MSK2-targeting siRNA, as indicated. Measurements were normalized to loading control (β-actin) and the mean of the PBS sample. Lines indicate mean ± SD. n = 9 biological replicates per condition. Representative Western blots are shown below. (E) Western blot for phospho-MSK2 (Ser360) and loading control (β-actin) from serum-starved IMR90 cells untreated (PBS) or treated with EGF for 30 min. (F) Representative confocal images of serum-starved IMR90 cells, untreated (PBS) or treated with EGF for 30 min, immunostained for MSK2 (green), and counterstained for DAPI (blue). Scale bars, 25 μm. Statistical analyses performed using two-way ANOVA. ****P < 0.0001.
Fig. 3.
Fig. 3.. A subset of EGF-induced transcriptional activation is MSK2 dependent.
(A) Volcano plots showing the differential gene expression patterns of serum-starved IMR90 cells treated with EGF for 30 or 60 min. Up-regulated genes (log fold change > 0.5; adjusted P < 0.05; green), down-regulated genes (log fold change < 0; adjusted P < 0.05; brown). (B) Venn diagram depicting the overlap of genes that are significantly up-regulated as measured after EGF treatment of 30 or 60 min. (C) GSEA enrichment plot on genes up-regulated after 60 min of EGF treatment compared to PBS in serum-starved IMR90 cells. Normalized enrichment score (NES) and adjusted P value are shown for the NAGASHIMA_EGF_SIGNALING_UP gene set in the C2 category of Molecular Signatures Database (MSigDB). (D) Heatmaps display normalized expression for differentially expressed genes (DEGs; adjusted P < 0.05 and ranked by descending log fold change). Left panel shows the top 50 DEGs after 30 min of EGF treatment. Right panel shows the top 50 DEGs unique to 60 min of EGF treatment. Colors are scaled by row in each heatmap. (E) Heatmap of all significant DEGs (adjusted P < 0.05) between PBS control, EGF 60-min treatment, and EGF 60-min treatment in cells with MSK2 knockdown. DEGs were grouped into clusters via hierarchical clustering based on gene expression across the three different conditions. The top cluster of genes was additionally tested for significant differential expression (adjusted P < 0.05) after 60 min of EGF treatment with or without MSK2 knockdown. These MSK2-dependent genes (n = 59) are labeled in blue next to the top cluster. Colors are scaled by row in each heatmap. (F) Schematic showing that a subset of EGF-stimulated transcription is activated through MSK2.
Fig. 4.
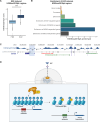
Fig. 4.. EGF stimulation induces locus-specific increases of H3K9me2S10ph.
(A) Distributions of average H3K9me2S10ph z scores in chromatin regions that were significantly enriched (adjusted P < 0.005) for H3K9me2S10ph in a comparison between IMR90 cells that were untreated (PBS) or treated with EGF for 30 min. Boxplots show median, 25% and 75% quartiles. (B) Enrichment (fold change of observed over expected overlap for randomly permuted genomic regions of equal sizes) of EGF-dependent H3K9me2S10ph regions for each annotation category. Categories as defined in Fig. 3: “Enhancers of EGF-regulated genes” refers to the complete set of 320 genes that were significantly differentially expressed after either 30 or 60 min of EGF stimulation; “Enhancers of EGF60-Up genes” refers to the 219 genes uniquely up-regulated after 60 min of EGF stimulation; “Enhancers of MSK2-dependent genes” refers to the 59 genes defined as MSK2 dependent; “Enhancers of MSK2-independent genes” refers to the 228 genes defined as MSK2 independent. All enrichment analyses were subjected to 1000 simulations; all P values < 0.001. (C) UCSC Genome Browser view (hg38) showing EGF-dependent H3K9me2S10ph in a region around the EGF-regulated and MSK2-dependent gene SNX18 (blue highlight). Linked Enhancers track shows GeneHancer annotations of SNX18-associated enhancers (gray boxes). Purple highlights indicate significant EGF-dependent H3K9me2S10ph regions [as in (A) and (B)] that overlap annotated enhancers. (D) Schematic of proposed model: EGF stimulation leads to the activation of the nuclear kinase MSK2, which mediates H3K9me2S10 phosphorylation at enhancers of EGF-responsive genes, leading to transcriptional activation. Schematic created with BioRender.

Similar articles

References

    1. Mahadevan L. C., Willis A. C., Barratt M. J., Rapid histone H3 phosphorylation in response to growth factors, phorbol esters, okadaic acid, and protein synthesis inhibitors. Cell 65, 775–783 (1991). - PubMed
    1. Barratt M. J., Hazzalin C. A., Cano E., Mahadevan L. C., Mitogen-stimulated phosphorylation of histone H3 is targeted to a small hyperacetylation-sensitive fraction. Proc. Natl. Acad. Sci. U.S.A. 91, 4781–4785 (1994). - PMC - PubMed
    1. Haws S. A., Yu D., Ye C., Wille C. K., Nguyen L. C., Krautkramer K. A., Tomasiewicz J. L., Yang S. E., Miller B. R., Liu W. H., Igarashi K., Sridharan R., Tu B. P., Cryns V. L., Lamming D. W., Denu J. M., Methyl-metabolite depletion elicits adaptive responses to support heterochromatin stability and epigenetic persistence. Mol. Cell 78, 210–223.e8 (2020). - PMC - PubMed
    1. Sabari B. R., Tang Z., Huang H., Yong-Gonzalez V., Molina H., Kong H. E., Dai L., Shimada M., Cross J. R., Zhao Y., Roeder R. G., Allis C. D., Intracellular crotonyl-CoA stimulates transcription through p300-catalyzed histone crotonylation. Mol. Cell 58, 203–215 (2015). - PMC - PubMed
    1. Reid M. A., Dai Z., Locasale J. W., The impact of cellular metabolism on chromatin dynamics and epigenetics. Nat. Cell Biol. 19, 1298–1306 (2017). - PMC - PubMed

Publication types