. 2024 Mar 15;10(11):eadg9278.
doi: 10.1126/sciadv.adg9278. Epub 2024 Mar 13.

The β-catenin C terminus links Wnt and sphingosine-1-phosphate signaling pathways to promote vascular remodeling and atherosclerosis

Affiliations

The β-catenin C terminus links Wnt and sphingosine-1-phosphate signaling pathways to promote vascular remodeling and atherosclerosis

Gustavo H Oliveira-Paula et al. Sci Adv. .

Abstract

Canonical Wnt and sphingosine-1-phosphate (S1P) signaling pathways are highly conserved systems that contribute to normal vertebrate development, with key consequences for immune, nervous, and cardiovascular system function; despite these functional overlaps, little is known about Wnt/β-catenin-S1P cross-talk. In the vascular system, both Wnt/β-catenin and S1P signals affect vessel maturation, stability, and barrier function, but information regarding their potential coordination is scant. We report an instance of functional interaction between the two pathways, including evidence that S1P receptor 1 (S1PR1) is a transcriptional target of β-catenin. By studying vascular smooth muscle cells and arterial injury response, we find a specific requirement for the β-catenin carboxyl terminus, which acts to induce S1PR1, and show that this interaction is essential for vascular remodeling. We also report that pharmacological inhibition of the β-catenin carboxyl terminus reduces S1PR1 expression, neointima formation, and atherosclerosis. These findings provide mechanistic understanding of how Wnt/β-catenin and S1P systems collaborate during vascular remodeling and inform strategies for therapeutic manipulation.


Figures

Fig. 1.
Fig. 1.. Smooth muscle β-catenin C-terminal signaling promotes neointima formation after carotid artery ligation.
(A) Schematic representation of the breeding strategy to obtain smooth muscle β-catenin C terminus–deficient (SMβCΔC) mice. Ctnnb1WT/flox;Rosa26LSL-TdTomato/WT;Acta2-CreERT2 mice were generated from the same breeders. (B) Representative Western blotting for β-catenin in total arterial protein lysates isolated from aortas of WT (SMβCWT/−), smooth muscle β-catenin C terminus–deficient (SMβCΔC), and smooth muscle β-catenin knockout (SMβC−/−) mice after tamoxifen injection. Different β-catenin antibodies targeting the C- or N-terminal domains (C-term or N-term, respectively) of the protein were used. Arterial lysates from smooth muscle β-catenin knockout (SMβC−/−) mice were used as a negative control. (C) Densitometric analysis of β-catenin protein levels evaluated by using distinct antibodies targeting the C- or N-terminal domain of the protein, normalized to GAPDH (n = 3). Statistical analysis: Unpaired Student’s t test. *P < 0.05. Data are means ± SEM of independent biological replicates. (D) Representative images of H&E-stained carotid arteries 21 days after ligation. Arrows delimit the neointimal layer, while arrowheads indicate the medial layer. Scale bars, 50 μm. (E to G) Morphometric measurements of the medial area (E), intimal area (F), and a ratio of intimal to medial area (G). Each dot represents a single mouse. Statistical analysis: Unpaired Student’s t test. Values are represented as means ± SEM of independent biological replicates. n = 11 for SMβCWT/− males, n = 7 for SMβCWT/− females, and n = 10 for SMβCΔC males and females.
Fig. 2.
Fig. 2.. Loss of SMC β-catenin C-terminal signaling decreases SMC proliferation and dedifferentiation and increases apoptosis.
(A) Immunostaining for PCNA, a marker of proliferation, and RFP, SMC lineage tracer, in carotid arteries 21 days after ligation. Dotted line marks the internal elastic lamina (IEL). Scale bar, 50 μm. (B) Percentage of SMCs positive for PCNA. Only nuclear signals were included in the quantification. Statistical analysis: Unpaired Student’s t test. n = 3. Data are means ± SEM of independent biological replicates. (C) Immunostaining for cleaved caspase-3 (Casp3), a marker of apoptosis, and RFP in carotid arteries 21 days after ligation. Dotted line marks the IEL. Scale bar, 50 μm. (D) Percentage of SMCs positive for cleaved caspase-3. Statistical analysis: Unpaired Student’s t test. n = 6 for SMβCWT/− and n = 7 for SMβCΔC. Data are means ± SEM of independent biological replicates. (E) Immunostaining for SMA and RFP in carotid arteries 21 days after ligation. Dotted line marks the IEL. Scale bar, 50 μm. (F) Percentage of SMCs positive for SMA in uninjured (control) and ligated carotid arteries. Statistical analysis: Unpaired Student’s t test. n = 3 for SMβCWT/− and n = 5 for SMβCΔC. Data are means ± SEM of independent biological replicates.
Fig. 3.
Fig. 3.. Loss of SMC β-catenin C-terminal signaling reduces SMC growth and down-regulates S1pr1 expression.
(A) Western blotting for β-catenin in βCControl and βCΔC MASMCs. Different antibodies targeting the C- or N-terminal domains (C-term or N-term, respectively) of β-catenin were used. *P < 0.05, unpaired Student’s t test. n = 3. ns, not significant. Data are means ± SEM of independent biological replicates. (B) Cell population growth of βCControl and βCΔC MASMCs. *P < 0.05, two-way ANOVA with Šídák’s multiple comparison test. n = 6. Data are means ± SEM of independent biological replicates. (C) PCA from RNA-seq of βCControl and βCΔC MASMCs. Each dot represents an independent sample. (D) Volcano plot. Each data point represents a gene. The log2 fold change of each gene is represented on the x axis, and the log10 of its adjusted P value (Padj) is on the y axis. Red dots indicate significantly up-regulated genes (log2 fold change > 1 and Padj < 0.05), while blue dots represent significantly down-regulated genes (log2 fold change < −1 and Padj < 0.05) in βCΔC MASMCs compared to βCControl. The black dots represent genes that do not satisfy the above conditions. (E) Significantly enriched canonical signaling pathways identified by IPA and ranked by P value. Positive and negative z scores indicate up- and down-regulated signaling pathways, respectively, in βCΔC versus βCControl MASMCs. (F) Heatmap derived from the RNA-seq data, showing the relative expression (color scale on the right) of Axin2, a known β-catenin target gene, and key components of the S1P signaling pathway in βCControl and βCΔC MASMCs. (G) qPCR for Axin2, S1pr1, and S1pr3, which were significantly down-regulated in βCΔC MASMCs in RNA-seq analysis. Rpl13 and β-actin were used as housekeeping controls. Statistical analysis: Unpaired Student’s t test. n = 6. Data are means ± SEM of independent biological replicates.
Fig. 4.
Fig. 4.. S1PR1 is a transcriptional target of β-catenin and rescues the defective growth of βCΔC MASMCs toward control levels.
(A) Representative Western blotting and densitometric analysis of S1PR1 in βCControl and βCΔC MASMCs, normalized to GAPDH. *P < 0.05, unpaired Student’s t test. n = 4. (B) Representative Western blotting and densitometric analysis of S1PR1 and β-catenin in βCControl and βCΔC MASMCs electroporated with empty vector or β-cateninS33Y, a constitutively active form of β-catenin. *P < 0.05, two-way ANOVA with Šídák’s multiple comparison test. n = 3. (C) Representative Western blotting and densitometric analysis of S1PR1 and β-catenin in βCControl and βCΔC MASMCs treated with CHIR99021 (CHIR), a small molecule that prevents β-catenin degradation. *P < 0.05, one-way ANOVA with Tukey’s multiple comparison test. n = 3. (D) βCControl and βCΔC MASMCs were co-electroporated with a human S1PR1-driven luciferase reporter (pGL3-S1PR1-promoter) and empty vector or β-cateninS33Y. Forty-eight hours after transfection, cells were harvested for luciferase assay. Luminescence (lum) was normalized to β-galactosidase activity (β-gal) to control for transfection efficiency and expressed relative to empty vector in βCControl MASMCs. *P < 0.05, two-way ANOVA with Šídák’s multiple comparison test. N = 6. (E) CUT&RUN assay was conducted in MASMCs using anti–β-catenin, anti-TCF4, and anti-IgG antibodies and analyzed by qPCR using primers that amplify different regions in the S1pr1 promoter containing (+) or not (−) a consensus TCF binding motif, 5′-TCAAAG. Indicated locations are relative to transcription start site. *P < 0.05, unpaired Student’s t test. N = 4. (F) Cell population growth of βCControl, βCΔC, βCControl S1PR1GOF, and βCΔC S1PR1GOF MASMCs. *P < 0.05 compared to other groups, two-way ANOVA with Šídák’s multiple comparison test. n = 6. Data shown in (A) to (F) are means ± SEM of independent biological replicates.
Fig. 5.
Fig. 5.. Reestablishing S1PR1 expression in SMCs rescues injury-induced neointima formation in β-catenin C terminus–deficient mice.
(A) Immunostaining for S1PR1 and RFP in carotid arteries 21 days after ligation. Dotted line marks the IEL. Scale bars, 75 μm. (B) Percentage of SMCs positive for S1PR1 in the media and neointima area of carotid arteries. Statistical analysis: Unpaired Student’s t test. n = 5. Data are means ± SEM of independent biological replicates. (C) Schematic representation of the breeding strategy to obtain smooth muscle–specific β-catenin C terminus–deficient mice with a GOF for S1PR1 (SMβCΔC SM-S1PR1GOF) mice. Ctnnb1WT/flox;Rosa26LSL-TdTomato/LSL-S1pr1;Acta2-CreERT2 mice were generated from the same breeders. (D) Representative images of H&E-stained carotid arteries from SMβCWT/−, SMβCΔC, SMβCWT/− SM-S1PR1GOF, and SMβCΔC SM-S1PR1GOF mice, 21 days after ligation. Arrows delimit the neointimal growth. Scale bars, 75 μm. (E and F) Morphometric measurements of the intimal area (E) and a ratio of intimal to medial area (F). Each dot represents a single mouse. Statistical analysis: Two-way ANOVA with Šídák’s multiple comparison test. n = 6 for SMβCWT/− males and females, n = 7 for SMβCΔC males and females, n = 7 for SMβCWT/− SM-S1PR1GOF males and females, and n = 8 for SMβCΔC SM-S1PR1GOF males and females. Values are represented as means ± SEM of independent biological replicates.
Fig. 6.
Fig. 6.. Pharmacologic inhibition of β-catenin C-terminal signaling attenuates neointimal formation and reduces S1PR1 expression in vivo.
(A) The β-catenin C-terminal inhibitor E7386 at 100 nM inhibits cell population growth of βCControl MASMCs but has no effect on βCΔC MASMCs. Statistical analysis: Two-way ANOVA with Šídák’s multiple comparison test. n = 6. *P < 0.05 compared to other groups. Data are means ± SEM of independent biological replicates. (B) Model schematic—mouse carotid artery ligation was followed by gavage with vehicle or E7386 (50 mg/kg twice daily) before tissue analysis after 14 days. (C) E7386 reduces in vivo expression of Axin2, a typical target β-catenin signaling. Right panels show merge of Axin2 and SMA signals (yellow). Dotted line marks the IEL. (D) Percentage of SMA+ cells positive for Axin2. n = 5 for each condition. (E) Representative images of H&E-stained carotid arteries at 14 days. Arrows delimit the neointimal growth. Scale bars, 50 μm. (F to H) Morphometric measurements of the medial area (F), intimal area (G), and a ratio of intimal to medial area (H). Each dot represents a single mouse; n = 7 for each group except n = 6 for E7386-treated females. Statistical analysis: Unpaired Student’s t test. Values are represented as means ± SEM of independent biological replicates. (I) E7386 reduces in vivo expression of S1PR1. Right panels show merge of S1PR1 and SMA signals (yellow). Dotted line marks the IEL. (J) Percentage of SMA+ cells positive for S1PR1. n = 4 for each condition. Scale bar, 50 μm. Statistical analysis: Unpaired Student’s t test. Values are represented as means ± SEM of independent biological replicates.
Fig. 7.
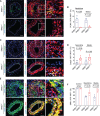
Fig. 7.. Pharmacologic inhibition of β-catenin C-terminal signaling limits atherosclerosis and decreases S1PR1 expression in SMCs from atherosclerotic lesions.
(A) Model schematic—Disturbed flow–induced atherosclerosis in the common carotid artery was induced in male ApoE−/− mice by partial carotid artery ligation and Western-type diet feeding, followed by gavage with vehicle or E7386 (25 mg/kg twice daily) before tissue analysis after 21 days. (B) Representative images of H&E-stained carotid arteries are shown. Scale bars, 50 μm. (C to H) Morphometric measurements of the medial area (C), lesion area (D), ratio of lesion to medial area (E), lumen area (F), necrotic core area (G), and fibrous cap thickness (H). Each dot represents a single mouse; n = 11 (vehicle) and n = 14 (E7386). Statistical analysis: Unpaired Student’s t test. Values are represented as means ± SEM of independent biological replicates. (I) S1PR1 expression. The middle panels show a merge of S1PR1 and SMA signals (yellow), and the white box indicates the inset shown in the right panels. Dotted line marks the IEL. Scale bar, 50 μm. (J) Percentage of SMA+ cells positive for S1PR1 in atherosclerotic lesions. Each dot represents a single mouse; n = 5 for each condition. Statistical analysis: Unpaired Student’s t test. Values are represented as means ± SEM of independent biological replicates.

References

    1. Roth G. A., Mensah G. A., Johnson C. O., Addolorato G., Ammirati E., Baddour L. M., Barengo N. C., Beaton A. Z., Benjamin E. J., Benziger C. P., Bonny A., Brauer M., Brodmann M., Cahill T. J., Carapetis J., Catapano A. L., Chugh S. S., Cooper L. T., Coresh J., Criqui M., DeCleene N., Eagle K. A., Emmons-Bell S., Feigin V. L., Fernandez-Sola J., Fowkes G., Gakidou E., Grundy S. M., He F. J., Howard G., Hu F., Inker L., Karthikeyan G., Kassebaum N., Koroshetz W., Lavie C., Lloyd-Jones D., Lu H. S., Mirijello A., Temesgen A. M., Mokdad A., Moran A. E., Muntner P., Narula J., Neal B., Ntsekhe M., Moraes de Oliveira G., Otto C., Owolabi M., Pratt M., Rajagopalan S., Reitsma M., Ribeiro A. L. P., Rigotti N., Rodgers A., Sable C., Shakil S., Sliwa-Hahnle K., Stark B., Sundstrom J., Timpel P., Tleyjeh I. M., Valgimigli M., Vos T., Whelton P. K., Yacoub M., Zuhlke L., Murray C., Fuster V., GBD-NHLBI-JACC Global Burden of Cardiovascular Diseases Writing Group, Global Burden of Cardiovascular Diseases and Risk Factors , 1990-2019: Update from the GBD 2019 Study. J. Am. Coll. Cardiol. 76, 2982–3021 (2020). - PMC - PubMed
    1. Alexander M. R., Owens G. K., Epigenetic control of smooth muscle cell differentiation and phenotypic switching in vascular development and disease. Annu. Rev. Physiol. 74, 13–40 (2012). - PubMed
    1. Lacolley P., Regnault V., Nicoletti A., Li Z., Michel J. B., The vascular smooth muscle cell in arterial pathology: A cell that can take on multiple roles. Cardiovasc. Res. 95, 194–204 (2012). - PubMed
    1. Cartier A., Hla T., Sphingosine 1-phosphate: Lipid signaling in pathology and therapy. Science 366, eaar5551 (2019). - PMC - PubMed
    1. Blaho V. A., Hla T., An update on the biology of sphingosine 1-phosphate receptors. J. Lipid Res. 55, 1596–1608 (2014). - PMC - PubMed

Publication types