. 2024 Oct 16;230(4):1033-1041.
doi: 10.1093/infdis/jiae133.

CD40 Expression by B Cells Is Required for Optimal Immunity to Murine Pneumocystis Infection

Affiliations

CD40 Expression by B Cells Is Required for Optimal Immunity to Murine Pneumocystis Infection

Monica Sassi et al. J Infect Dis. .

Abstract

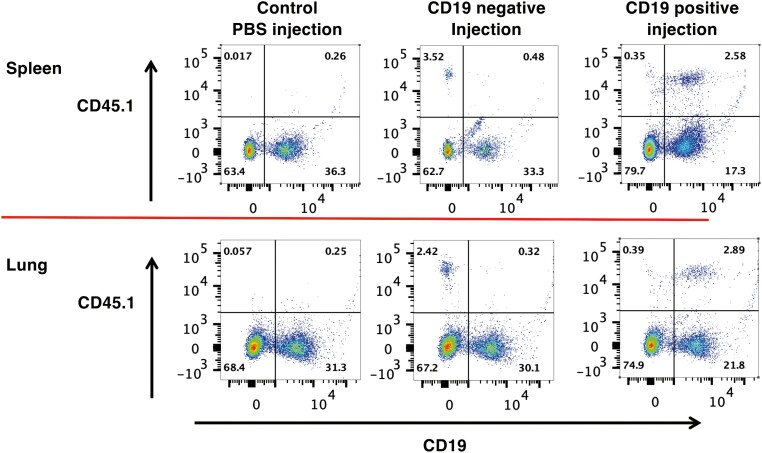
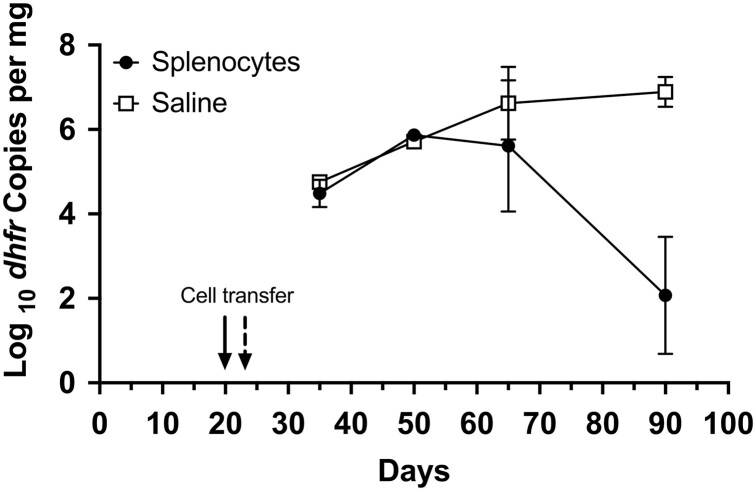
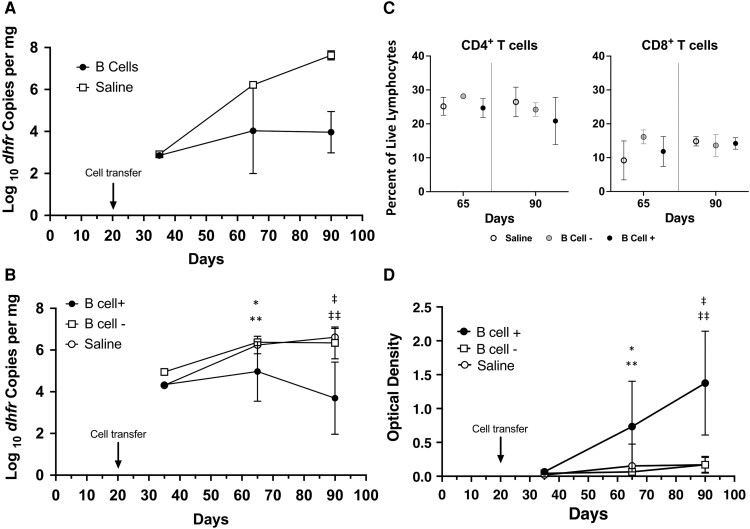
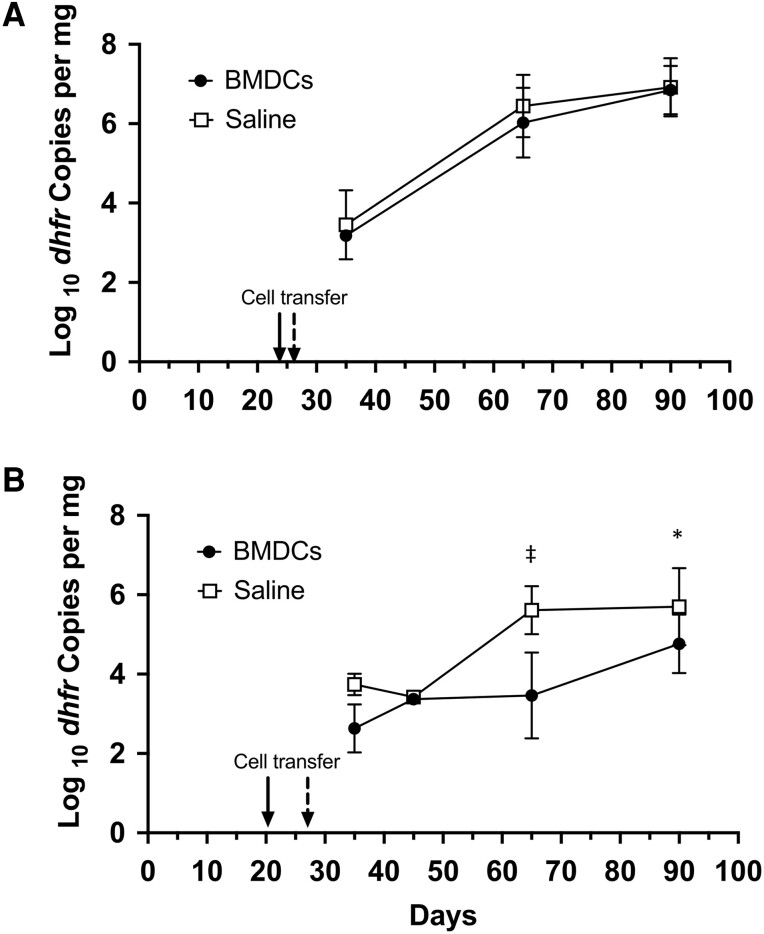
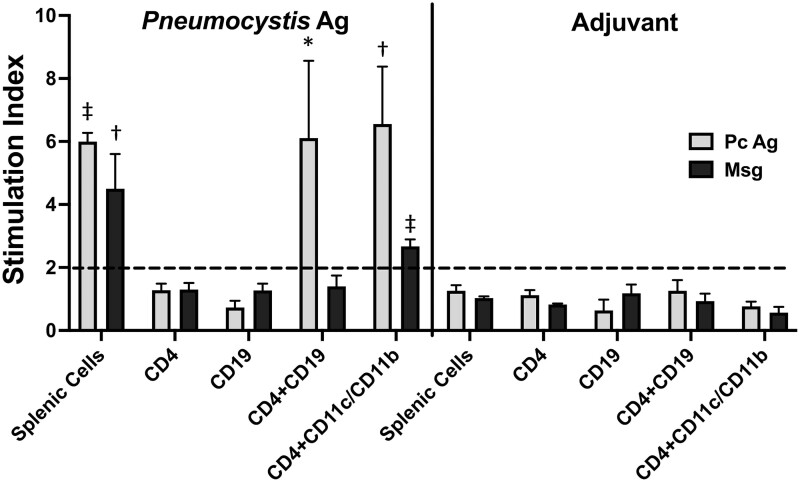
CD40-CD40 ligand interactions are critical for controlling Pneumocystis infection. However, which CD40-expressing cell populations are important for this interaction have not been well defined. We used a cohousing mouse model of Pneumocystis infection, combined with flow cytometry and quantitative polymerase chain reaction, to examine the ability of different populations of cells from C57BL/6 mice to reconstitute immunity in CD40 knockout mice. Unfractionated splenocytes, as well as purified B cells, were able to control Pneumocystis infection, while B cell-depleted splenocytes and unstimulated bone marrow-derived dendritic cells were unable to control infection in CD40 knockout mice. Pneumocystis antigen-pulsed bone marrow-derived dendritic cells showed early but limited control of infection. Additional findings were consistent with recent studies that suggested a role for antigen presentation by B cells; specifically, by using cells from immunized animals, B cells were able to present Pneumocystis antigens to induce proliferation of T cells. Thus, CD40 expression by B cells appears necessary for robust immunity to Pneumocystis.

Keywords: Pneumocystis pneumonia; B cells; CD40; CD40L; mouse model.


Conflict of interest statement

Potential conflicts of interest. All authors: No reported conflicts. All authors have submitted the ICMJE Form for Disclosure of Potential Conflicts of Interest.

Figures

Figure 1.
Figure 1.
Flow cytometry analysis of lung and spleen cells following transfer of CD19− cells or CD19+ B cells; gating was on live cells, then lymphocytes, then CD19 and CD45.1. Representative results are shown for spleen and lung cells from CD40 knockout mice exposed to a Pneumocystis-infected seeder for 65 days. The exposed mice were reconstituted at day 20 with PBS (control), CD19+ B cells (positive), or CD19-depleted spleen cells (negative). Transferred B cells (CD45.1+/CD19+) were detected in the spleen and lung of the mouse that received CD19+ B cells, while transferred non–B cells were detected in the mouse that received cells that had been depleted of CD19+ B cells. Neither population was detected in the mouse that received PBS. PBS, phosphate-buffered saline.
Figure 2.
Figure 2.
Transfer of splenocytes controls Pneumocystis murina infection in CD40 knockout mice. CD40 knockout mice were cohoused with a P murina–infected seeder beginning at day 0. At day 20 (cage 1) or day 24 (cage 2), mice were injected via the tail vein with phosphate-buffered saline or approximately 50 million splenocytes from C57BL/6 mice. Organism loads were determined by quantitative polymerase chain reaction targeting the single-copy dfhr gene and are expressed as dhfr copies per milligram of lung tissue. Data represent the geometric mean ± SD for 2 to 4 mice per time point for the splenocyte group and 1 (day 50) or 2 mice per time point for the phosphate-buffered saline control group. P values were not significant, potentially due to the small sample per group.
Figure 3.
Figure 3.
Transfer of B cells is sufficient to control Pneumocystis murina infection in CD40 knockout mice. A, CD40 knockout mice were cohoused with a P murina–infected seeder beginning at day 0. At day 20, mice were injected via the tail vein with phosphate-buffered saline or approximately 28 million CD19+ B cells from C57BL/6 mice. A and B, Organism loads were determined by quantitative polymerase chain reaction targeting the single-copy dfhr gene and are expressed as dhfr copies per milligram of lung tissue. Data represent the geometric mean ± SD for 2 or 3 mice per time point for the splenocyte group and 1 (days 25 and 65) or 2 (day 90) mice per time point for the phosphate-buffered saline control group. P values were not significant, potentially due to the small sample per group. B, CD40 knockout mice cohoused as indicated received CD19+ B cells (B cell+, approximately 50 million cells/mouse), splenocytes that had been depleted of CD19+ B cells (B cell, approximately 15–25 million cells/mouse), or saline at day 20. For these studies, the focus was on later time points (days 65 and 90), when the differences were seen in the prior studies, to allow for greater numbers of mice at each time point, given the restrictions on the number of mice permitted per cage. In one experiment, no flow data were available due to technical difficulties at day 65; all animals from that time point were included in the analysis. Data represent the geometric mean ± SD. The number of mice per time point is as follows: day 35, n = 1 for each group; day 65, 7 to 12 per group; day 90, 6 to 9 per group. A Mann-Whitney test was used to compare the groups at each time point. *P = .004 for B cell+ vs B cell. **P = .007 for B cell+ vs saline. P = .004 for B cell+ vs B cell. ‡‡P = .0002 for B cell+ vs saline. C, Pulmonary CD4+ (left) and CD8+ (right) T cells, as determined by flow cytometry and shown as a percentage of live lymphocytes, for the 3 groups at days 65 and 90. Symbols and error bars represent mean ± SD. No significant differences were seen among the groups at either time point. D, Anti-Pneumocystis antibodies, as determined by enzyme-linked immunosorbent assay, for the animals in panel B demonstrated that mice receiving CD19+ B cells developed antibodies by day 65 with a further increase by day 90, while no antibodies developed in the other 2 groups. Data represent mean ± SD. A Mann-Whitney test was used to compare the different groups at each time point. *P = .003 for B cell+ vs B cell. **P = .005 for B cell+ vs saline. P = .0003 for B cell+ vs B cell. ‡‡P = .00008 for B cell+ vs saline.
Figure 4.
Figure 4.
Transfer of BMDCs is insufficient to control Pneumocystis murina infection in CD40 knockout mice. A, CD40 knockout mice were cohoused with a P murina–infected seeder beginning at day 0. At days 24 to 26, mice were injected via the tail vein with PBS or approximately 2.5 to 12 million BMDCs from C57BL/6 mice. A and B, Organism loads were determined by quantitative polymerase chain reaction targeting the single-copy dfhr gene and are expressed as dhfr copies per milligram of lung tissue. Data represent the geometric mean ± SD for 2 to 5 mice per time point for the BMDC group and 2 or 3 mice per time point for the PBS control group. B, CD40 knockout mice cohoused as indicated received PBS or 10 million antigen-primed BMDCs at day 20 (5 cages) or day 27 (1 cage); the BMDCs had been incubated with a crude P murina antigen overnight prior to transfer. For the latter cage, 1 mouse from each group was harvested at day 45 rather than day 35 as the earliest time point. For the other times, data represent the geometric mean ± SD for 4 to 15 mice per time point for the BMDC group and 2 to 11 mice per time point for the PBS control group. A Mann-Whitney test was used to compare the groups at each time point. *P = .005. P = .0007. BMDC, bone marrow–derived dendritic cell; PBS, phosphate-buffered saline.
Figure 5.
Figure 5.
B cells can present Pneumocystis murina antigens in vitro. A cell proliferation assay was used to determine if Pneumocystis antigens, presented by B cells or dendritic cells plus monocytes, could induce CD4+ T cells to proliferate. Spleen cells from 3 or 4 C57BL/6 mice that had been immunized with 20 µg of crude P murina antigen or adjuvant alone were combined and purified by cell sorting to provide populations of CD4+ T cells, CD19+ B cells, and CD11c+/CD11b+ dendritic cells and monocytes. Purified CD4+ T cells (44 000/well) were cultured for 5 days alone or with B cells (50 000/well) or dendritic cells/monocytes (5000 cells/well) incubated with P murina antigen (Pc Ag; 20 µg/mL), purified major surface glycoprotein (Msg; 10 µg/mL), or media alone. CD4+ T cells or B cells cultured alone and unpurified splenocytes served as controls. Results are shown as mean stimulation index of 3 replicates for each condition and for 1 of 2 experiments with similar results. Error bars indicate SD. P values are shown for the difference between the relative light units of the antigen-incubated wells and no antigen control wells per a Student unpaired t test. *P < .05. P < .01. P < .001.

Update of

Similar articles

Cited by

References

    1. Kovacs JA, Masur H. Evolving health effects of Pneumocystis: one hundred years of progress in diagnosis and treatment. JAMA 2009; 301:2578–85. - PubMed
    1. Thomas CF Jr, Limper AH. Pneumocystis pneumonia. N Engl J Med 2004; 350:2487–98. - PubMed
    1. Levy J, Espanol-Boren T, Thomas C, et al. . Clinical spectrum of X-linked hyper-IgM syndrome. J Pediatr 1997; 131:47–54. - PubMed
    1. Maini R, Henderson KL, Sheridan EA, et al. . Increasing Pneumocystis pneumonia, England, UK, 2000–2010. Emerg Infect Dis 2013; 19:386–92. - PMC - PubMed
    1. Martin SI, Fishman JA. Pneumocystis pneumonia in solid organ transplantation. Am J Transplant 2013; 13:272–9. - PubMed