Resolving the Nanoscale Structure of β-Sheet Peptide Self-Assemblies Using Single-Molecule Orientation-Localization Microscopy
- PMID: 38478911
- PMCID: PMC11025465
- DOI: 10.1021/acsnano.3c11771
Resolving the Nanoscale Structure of β-Sheet Peptide Self-Assemblies Using Single-Molecule Orientation-Localization Microscopy
Abstract
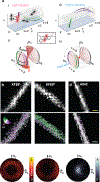
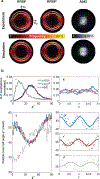
Synthetic peptides that self-assemble into cross-β fibrils are versatile building blocks for engineered biomaterials due to their modularity and biocompatibility, but their structural and morphological similarities to amyloid species have been a long-standing concern for their translation. Further, their polymorphs are difficult to characterize by using spectroscopic and imaging techniques that rely on ensemble averaging to achieve high resolution. Here, we utilize Nile red (NR), an amyloidophilic fluorogenic probe, and single-molecule orientation-localization microscopy (SMOLM) to characterize fibrils formed by the designed amphipathic enantiomers KFE8L and KFE8D and the pathological amyloid-beta peptide Aβ42. Importantly, NR SMOLM reveals the helical (bilayer) ribbon structure of both KFE8 and Aβ42 and quantifies the precise tilt of the fibrils' inner and outer backbones in relevant buffer conditions without the need for covalent labeling or sequence mutations. SMOLM also distinguishes polymorphic branched and curved morphologies of KFE8, whose backbones exhibit much more heterogeneity than those of typical straight fibrils. Thus, SMOLM is a powerful tool to interrogate the structural differences and polymorphism between engineered and pathological cross-β-rich fibrils.
Keywords: fluorogenic probes; polymorphism; self-assembly; super-resolution microscopy; supramolecular helix.
Conflict of interest statement
The authors declare no competing financial interest.
Figures


Update of
-
Resolving the nanoscale structure of β-sheet assemblies using single-molecule orientation-localization microscopy.bioRxiv [Preprint]. 2023 Sep 14:2023.09.13.557571. doi: 10.1101/2023.09.13.557571. bioRxiv. 2023. Update in: ACS Nano. 2024 Mar 26;18(12):8798-8810. doi: 10.1021/acsnano.3c11771. PMID: 37745382 Free PMC article. Updated. Preprint.
Similar articles
-
Single-Molecule Orientation Imaging Reveals the Nano-Architecture of Amyloid Fibrils Undergoing Growth and Decay.bioRxiv [Preprint]. 2024 Mar 27:2024.03.24.586510. doi: 10.1101/2024.03.24.586510. bioRxiv. 2024. Update in: Nano Lett. 2024 Jun 3. doi: 10.1021/acs.nanolett.4c01263. PMID: 38585908 Free PMC article. Updated. Preprint.
-
Resolving the nanoscale structure of β-sheet assemblies using single-molecule orientation-localization microscopy.bioRxiv [Preprint]. 2023 Sep 14:2023.09.13.557571. doi: 10.1101/2023.09.13.557571. bioRxiv. 2023. Update in: ACS Nano. 2024 Mar 26;18(12):8798-8810. doi: 10.1021/acsnano.3c11771. PMID: 37745382 Free PMC article. Updated. Preprint.
-
Polymorphic Aβ42 fibrils adopt similar secondary structure but differ in cross-strand side chain stacking interactions within the same β-sheet.Sci Rep. 2020 Mar 31;10(1):5720. doi: 10.1038/s41598-020-62181-x. Sci Rep. 2020. PMID: 32235842 Free PMC article.
-
Elucidating the Structures of Amyloid Oligomers with Macrocyclic β-Hairpin Peptides: Insights into Alzheimer's Disease and Other Amyloid Diseases.Acc Chem Res. 2018 Mar 20;51(3):706-718. doi: 10.1021/acs.accounts.7b00554. Epub 2018 Mar 6. Acc Chem Res. 2018. PMID: 29508987 Free PMC article. Review.
-
Self-assembly of Functional Nanostructures by Short Helical Peptide Building Blocks.Protein Pept Lett. 2019;26(2):88-97. doi: 10.2174/0929866525666180917163142. Protein Pept Lett. 2019. PMID: 30227810 Free PMC article. Review.
Cited by
-
Single-Molecule Orientation Imaging Reveals the Nano-Architecture of Amyloid Fibrils Undergoing Growth and Decay.Nano Lett. 2024 Jun 3:10.1021/acs.nanolett.4c01263. doi: 10.1021/acs.nanolett.4c01263. Online ahead of print. Nano Lett. 2024. PMID: 38828968
-
Single-Molecule Orientation Imaging Reveals the Nano-Architecture of Amyloid Fibrils Undergoing Growth and Decay.bioRxiv [Preprint]. 2024 Mar 27:2024.03.24.586510. doi: 10.1101/2024.03.24.586510. bioRxiv. 2024. Update in: Nano Lett. 2024 Jun 3. doi: 10.1021/acs.nanolett.4c01263. PMID: 38585908 Free PMC article. Updated. Preprint.
-
Fundamental Limits in Measuring the Anisotropic Rotational Diffusion of Single Molecules.J Phys Chem A. 2024 Jul 18;128(28):5808-5815. doi: 10.1021/acs.jpca.4c03160. Epub 2024 Jul 8. J Phys Chem A. 2024. PMID: 38978460 Free PMC article.
-
Single-molecule orientation-localization microscopy: Applications and approaches.Q Rev Biophys. 2024 Dec 23;57:e17. doi: 10.1017/S0033583524000167. Q Rev Biophys. 2024. PMID: 39710866 Free PMC article. Review.
References
Publication types
MeSH terms
Substances
Grants and funding
LinkOut - more resources
Full Text Sources

