. 2024 Apr 10;32(4):606-622.e8.
doi: 10.1016/j.chom.2024.02.011. Epub 2024 Mar 12.

Pathophysiology of chikungunya virus infection associated with fatal outcomes

Affiliations

Pathophysiology of chikungunya virus infection associated with fatal outcomes

William M de Souza et al. Cell Host Microbe. .

Abstract

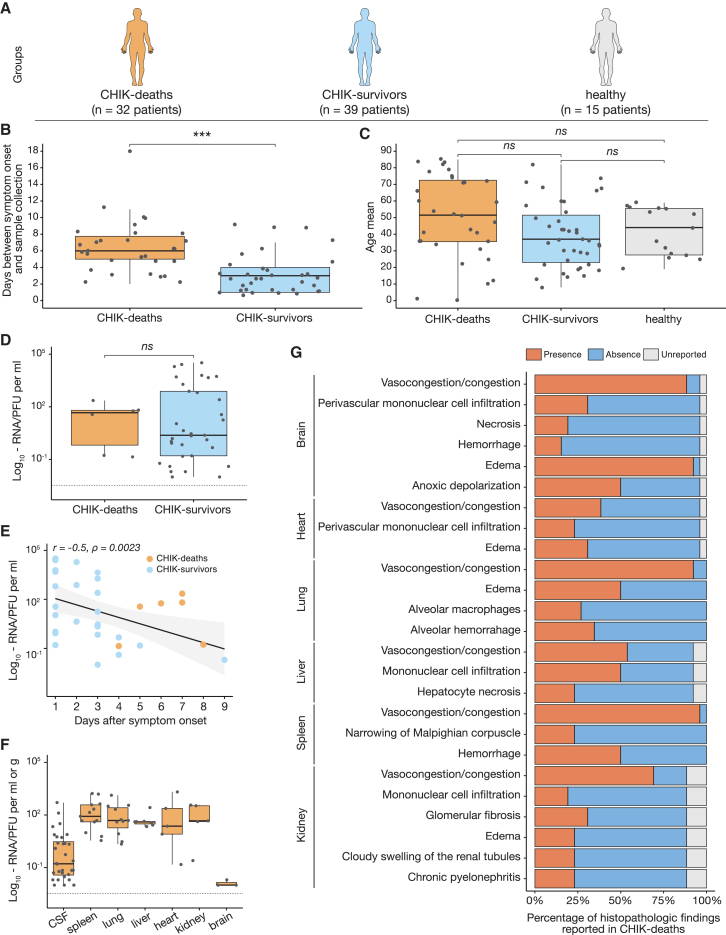
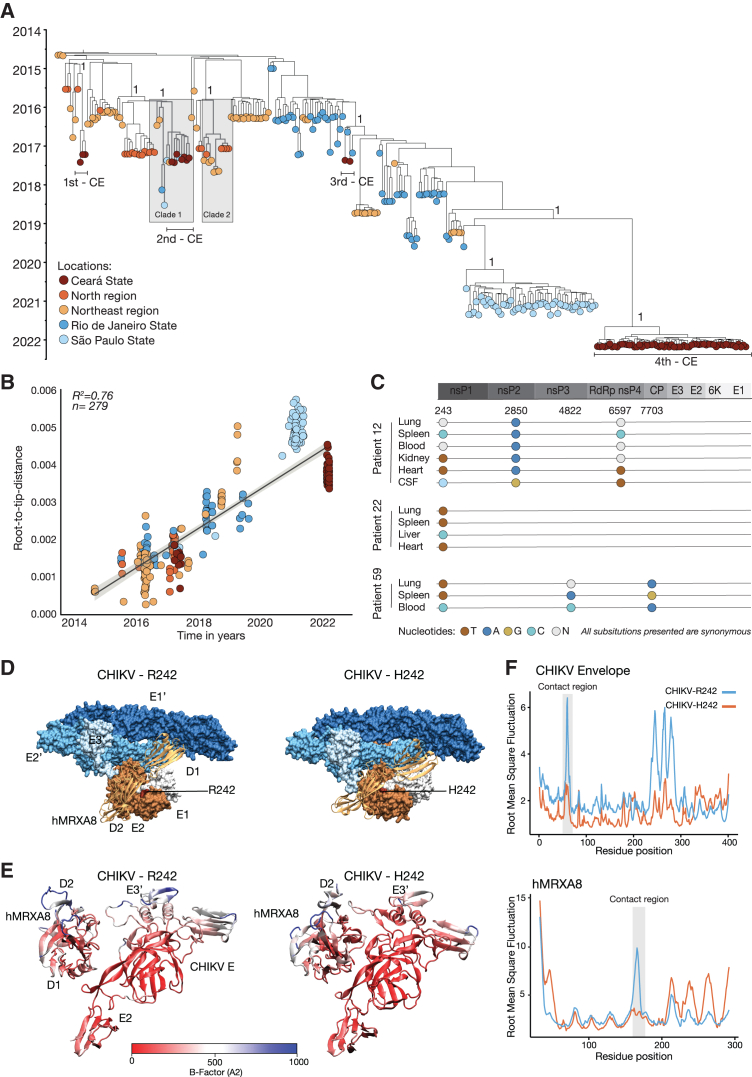
Chikungunya virus (CHIKV) is a mosquito-borne alphavirus that causes acute, subacute, and chronic human arthritogenic diseases and, in rare instances, can lead to neurological complications and death. Here, we combined epidemiological, virological, histopathological, cytokine, molecular dynamics, metabolomic, proteomic, and genomic analyses to investigate viral and host factors that contribute to chikungunya-associated (CHIK) death. Our results indicate that CHIK deaths are associated with multi-organ infection, central nervous system damage, and elevated serum levels of pro-inflammatory cytokines and chemokines compared with survivors. The histopathologic, metabolite, and proteomic signatures of CHIK deaths reveal hemodynamic disorders and dysregulated immune responses. The CHIKV East-Central-South-African lineage infecting our study population causes both fatal and survival cases. Additionally, CHIKV infection impairs the integrity of the blood-brain barrier, as evidenced by an increase in permeability and altered tight junction protein expression. Overall, our findings improve the understanding of CHIK pathophysiology and the causes of fatal infections.

Keywords: alphavirus; arbovirus; central nervous system infection; chikungunya death; chikungunya virus; hemodynamic disorders; inflammation; mosquito-borne virus; pathophysiology.


Conflict of interest statement

Declaration of interests M.S.D. is a consultant or advisor for Inbios, Ocugen, Vir Biotechnology, Topspin Therapeutics, Moderna, Merck, and Immunome. The Diamond laboratory has received funding support from Emergent BioSolutions, Moderna, and Vir Biotechnology.

Figures

None
Graphical abstract
Figure 1
Figure 1
Epidemiology of chikungunya deaths in Brazil (A) Number of suspected chikungunya deaths per year from January 2015 to June 2023. (B) Pearson’s correlation between suspected chikungunya deaths per year and suspected chikungunya cases per year from January 2015 to June 2023, with key states labeled. (C) Map colored according to the cumulative case-fatality ratio of chikungunya deaths per state from January 2015 to June 2023. AC, Acre; AL, Alagoas; AM, Amazonas; AP, Amapá; BA, Bahia; CE, Ceará; ES, Espírito Santo; DF, Distrito Federal (Federal District); GO, Goiás; MA, Maranhão; MG, Minas Gerais; MS, Mato Grosso do Sul; MT, Mato Grosso; PA, Pará; PB, Paraíba; PE, Pernambuco; PI, Piauí; PR, Paraná; RJ, Rio de Janeiro; RN, Rio Grande do Norte; RO, Rondônia; RR, Roraima; RS, Rio Grande do Sul; SC, Santa Catarina; SE, Sergipe; SP, São Paulo; TO, Tocantins; CHIK, chikungunya; km, kilometers.
Figure 2
Figure 2
Study design, viral load, and histopathological analyses (A) Study design representing the patient groups evaluated. (B) Days between symptom onset and sample collection. The p values were calculated using the Welch’s t test (30 CHIK deaths versus 35 CHIK survivors). (C) Age distribution of chikungunya patients and controls is shown in years. The p values were calculated using the Wilcoxon signed-rank test with the Dunn-Bonferroni post hoc test. (D) CHIKV RNA concentration (PFU equivalents/mL) in serum as determined by RT-qPCR in CHIK survivors (n = 36) and CHIK deaths (n = 6). (E) Correlation between viremia and time from symptom onset to sample collection samples in days. The correlation was calculated using Spearman’s rank correlation coefficient. (F) CHIKV RNA load (PFU equivalents/grams of tissue) as determined by RT-qPCR in tissue samples of CHIK deaths: CSF (n = 32), spleen (n = 13), lung (n = 11), liver (n = 7), heart (n = 5), kidney (n = 5), and brain (n = 3). (G) Histopathologic findings from the necropsy samples of CHIK deaths (n = 26). Horizontal axes show the percentage of histopathologic findings reported in each fatal chikungunya case. The bar in the boxplots represents the median (middle line), the upper and lower limits represent the 75th and 25th percentiles, and minimum and maximum values (whiskers). Dots represent individual patients. Statistical significance is ∗∗∗p < 0.001, ∗∗p < 0.01, and p < 0.05; ns, not significant. CHIK, chikungunya; PFUs, plaque-forming units; CSF, cerebrospinal fluid; RT-qPCR, reverse transcription quantitative polymerase chain reaction.
Figure 3
Figure 3
Cytokine responses and metabolomic signatures of chikungunya patients (A) Serum cytokine profiles of chikungunya patients (fatalities, n = 13, and survivors, n = 12) were compared with healthy controls (n = 15). Statistical analyses were performed using the Wilcoxon signed-rank test with the Dunn-Bonferroni post hoc test. IFN, interferon; IL, interleukin; TNF, tumor necrosis factor; GM-CSF, granulocyte-macrophage colony-stimulating factor; CCL-2, chemokine ligand 2. (B) Heatmap analysis of selected metabolite markers for chikungunya patients (D, deaths; S, survivors; C, chikungunya cases from both outcomes) compared with healthy blood donors (H) shows the log2 FC and the p value. The log2-fold changes (log2 FCs) are scaled from blue (low intensity) to red (high intensity). Statistical analyses were performed using the Wilcoxon test in MetaboAnalyst. (C) The expression level change (normalized log10-transformed ion intensity) of eight selected regulated metabolites with significant differences between chikungunya patients and healthy controls. Statistical analyses were performed using the Wilcoxon sign-rank test with the Dunn-Bonferroni post hoc test. The bar in the boxplots represents the median (middle line), the upper and lower limits represent the 75th and 25th percentiles, and minimum and maximum values (whiskers). Dots represent individual patients. Statistical significance is ∗∗∗p < 0.001, ∗∗p < 0.01, and p < 0.05; ns, not significant.
Figure 4
Figure 4
Proteomic signatures of chikungunya patients with different disease outcomes (A) The proteomic profiles of the most significantly differentially expressed proteins in chikungunya patients (deaths, n = 13, and survivors, n = 11) and healthy controls (n = 15). The color intensity is related to the normalized abundance for each protein. All proteomic analyses were performed in technical duplicate. The relative intensities (Z score) for each are scaled from blue (low intensity) to red (high intensity). Samples were clustered according to Pearson correlation coefficient distance. (B) Principal-component analysis of the proteomic data from the serum samples of chikungunya patients (i.e., deaths and survivors) compared with blood donors (healthy). Each dot represents one patient and the respective technical replicate, color-coded for the different groups described in the figure. (C) Volcano plot displaying the log2-fold change (x axis) against the t test-derived −log10 statistical p value (y axis) for all proteins differentially expressed between chikungunya deaths and chikungunya survivors. Proteins with significantly decreased levels (p < 0.05) are shown in blue, and proteins with significantly increased levels are noted in red. The gray circles indicate unaltered proteins. All the proteins are shown. (D) Protein-protein interaction analysis using proteins related to the hemostasis pathway (hemostasis, platelet degranulation, complement and coagulation, and formation of fibrin clot) and immune system pathways (neutrophil degranulation, biosynthesis of amino acids, glycolysis/gluconeogenesis, post-translational protein phosphorylation) from chikungunya deaths compared with chikungunya survivors. Gene symbols (abbreviation names) for protein-coding genes followed the nomenclature approved by the HUGO Gene Nomenclature Committee.
Figure 5
Figure 5
Phylogenetic, intrahost diversity, and molecular dynamics of CHIKV-ECSA in Brazil (A) Time-rooted phylogenetic tree of the CHIKV East-Central-South African lineage in Brazil (n = 279), including 45 new sequences from this study. Tips are colored according to the source region or state of each sample. (B) Regression of sequence sampling dates against a root-to-tip genetic distance in a maximum likelihood phylogeny of the CHIKV-ECSA lineage in Brazil. Sequences are colored according to five locations (Ceará, Rio de Janeiro, and São Paulo States, and North and Northeast regions of Brazil). (C) Intrahost single nucleotide polymorphisms associated with three chikungunya deaths (patients 12, 22, and 59). (D) The E2-R242H substitution is shown in the complex structure of the CHIKV E3-E2-E1 glycoprotein spike bound to the human MXRA8 receptor. The 90° rotation on the right panel shows the top view of the complex. (E) Average structures for the E2-E3-hMRXA8 complex that appear in the ancestral and mutant strains, colored according to the beta temperature factor of each residue. Red regions correspond to low-mobility regions, whereas blue regions correspond to high-mobility regions. (F) Root mean square fluctuation plots for the ancestral E2-R242 (blue line) and the E2-H242 substitution (red line) systems regarding their E2-E3 proteins and the hMRXA8 receptor. Residues located in the contact region are highlighted for both structures. Non-structural (ns) proteins. C-capsid; E-envelope. RdRp, RNA-dependent RNA polymerase; T, thymine; A, adenine; C, cytosine; G, guanine; N, undetermined based.
Figure 6
Figure 6
Leukocyte transendothelial migration during chikungunya virus infection in a human blood-brain barrier model (A) Quantification of the number of lymphocytes (CD45+), monocytes (CD14+), and CD14+CD16+ monocytes migrating from the luminal (upper) to the abluminal (lower) chamber during 24 h. PBMCs infected with CHIKV at a multiplicity of infection (MOI) of 0.1, in the presence or absence of CCL-2 at 100 ng/mL. Fluorescence-activated cell sorting was used to identify lymphocytes (CD45+), monocytes (CD14+), and CD14+CD16+ monocytes, and CHIKV-infected cells. (B) Percentage of permeability of the BBB model, assessed by quantifying the passage of albumin conjugated to Evans blue dye through cocultures of primary human brain microvascular endothelial cells (BMVECs) and human primary astrocytes. Mock is only cocultures. CCL-2 is cocultures plus CCL-2 at 100 ng/mL. PBMC is peripheral blood mononuclear cells (PBMCs), cocultures, and CCL-2 at 100 ng/mL. CHIKV is PBMC infected with CHIKV at MOI of 0.1 plus cocultures, and CCL-2 at 100 ng/mL. EDTA is coculture and treatment with 4 mM of ethylenediaminetetraacetic acid (EDTA) as a positive control for disruption of the BBB. The data are expressed as a percentage of permeability related to EDTA. (C) Percentage of permeability of the BBB model, assessed by quantifying the passage of fluorescein isothiocyanate (FITC)-dextran 4kDa through cocultures of BMVECs and human primary astrocytes. Uninfected is only coculture. CHIKV is coculture infected with CHIKV at MOI of 0.1 PFU/cell. EDTA is coculture and treatment with 4 mM of EDTA. (D) Viral titration was measured in the luminal and abluminal chambers of the trans-well plates by TCID50 assay. (E) Levels of soluble platelet endothelial cell adhesion molecule 1 (sPECAM-1) in media from PBMCs infected with CHIKV compared with uninfected PBMCs. (F) Serum levels of sPECAM-1 in uninfected individuals (n = 8) and CHIK patients (n = 8). Data are presented as the mean ± standard deviation. Statistical analyses were performed using the paired t test, one-way ANOVA, and Kruskal-Wallis test. Statistical significance is ∗∗∗p < 0.001, ∗∗p < 0.01, and p < 0.05; ns, not significant. Dots represent individual biological replicates. −CCL-2, absence of CCL-2. +CCL-2, presence of 100 ng/mL of CCL-2.
Figure 7
Figure 7
Disruption of primary human brain microvascular endothelial monolayer during chikungunya virus infection (A) Immunofluorescence analysis of PECAM-1 in CHIKV-infected (MOI 0.1, 24 h) primary human brain microvascular endothelial cells (BMVECs) at 90% confluence. Co-staining with 4,6-diamidino-2-phenylindole (DAPI) labels the nucleus (blue), CHIKV-infected infected cells (red), and actin (gray). Areas of colocalization (merge) appear yellow. (B) Immunofluorescence analysis of ZO-1 (green) in CHIKV-infected (MOI 0.1, 24 h) BMVECs at 90% confluence. Co-staining with DAPI labels the nucleus (blue), and CHIKV-infected infected cells labeled CHIKV-envelope protein antibody (red). Areas of colocalization (merge) appear yellow. (C) Quantitation of ZO-1 and PECAM-1 mean fluorescence intensity (MFI) of ten individual representative regions of interest (ROIs). Total ZO-1 expression (upper left), nuclear ZO-1 expression (upper middle), ZO-1 expression in membrane cells adjacent to E2-CHIKV-positive cells (upper right), total PECAM-1 (bottom left), and percentage of positive PECAM-1 (bottom right) in CHIKV-positive cells (E2-positive), CHIKV-negative cells (E2-negative), and uninfected cells. Data are presented as the mean ± standard deviation. Statistical analyses were performed using the paired t test and one-way ANOVA. Statistical significance is ∗∗∗p < 0.001, ∗∗p < 0.01, and p < 0.05; ns, not significant.

References

    1. Suhrbier A. Rheumatic manifestations of chikungunya: emerging concepts and interventions. Nat. Rev. Rheumatol. 2019;15:597–611. - PubMed
    1. Nsoesie E.O., Kraemer M.U., Golding N., Pigott D.M., Brady O.J., Moyes C.L., Johansson M.A., Gething P.W., Velayudhan R., Khan K., et al. Global distribution and environmental suitability for chikungunya virus, 1952 to 2015. Euro Surveill. 2016;21:20. - PMC - PubMed
    1. Torales M., Beeson A., Grau L., Galeano M., Ojeda A., Martinez B., León N., Cabello A., Rojas F., de Egea V., et al. Notes from the Field: Chikungunya Outbreak - Paraguay, 2022-2023. MMWR Morb. Mortal. Wkly. Rep. 2023;72:636–638. - PMC - PubMed
    1. de Souza W.M., Ribeiro G.S., de Lima S.T.S., de Jesus R., Moreira F.R.R., Whittaker C., Sallum M.A.M., Carrington C.V.F., Sabino E.C., Kitron U., et al. Chikungunya: a decade of burden in the Americas. Lancet Reg. Health Am. 2024;30:100673. - PMC - PubMed
    1. Tjaden N.B., Suk J.E., Fischer D., Thomas S.M., Beierkuhnlein C., Semenza J.C. Modelling the effects of global climate change on Chikungunya transmission in the 21st century. Sci. Rep. 2017;7:3813. - PMC - PubMed