. 2024 Mar 22;38(3-4):189-204.
doi: 10.1101/gad.351278.123.

Coordination of histone chaperones for parental histone segregation and epigenetic inheritance

Affiliations

Coordination of histone chaperones for parental histone segregation and epigenetic inheritance

Yimeng Fang et al. Genes Dev. .

Abstract

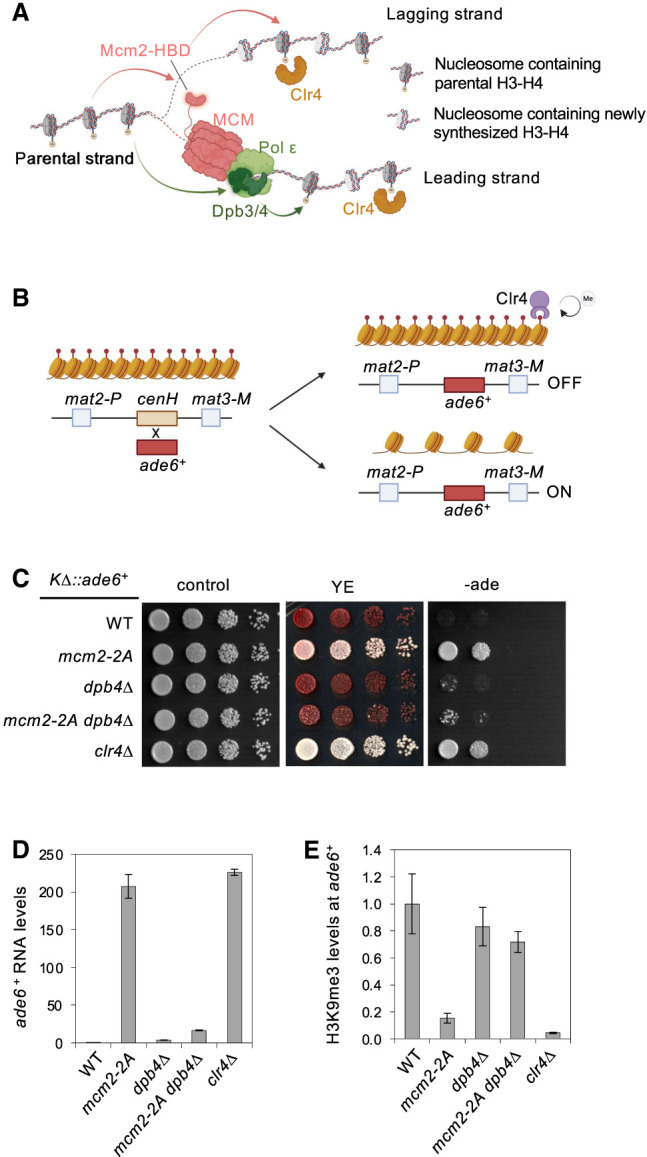
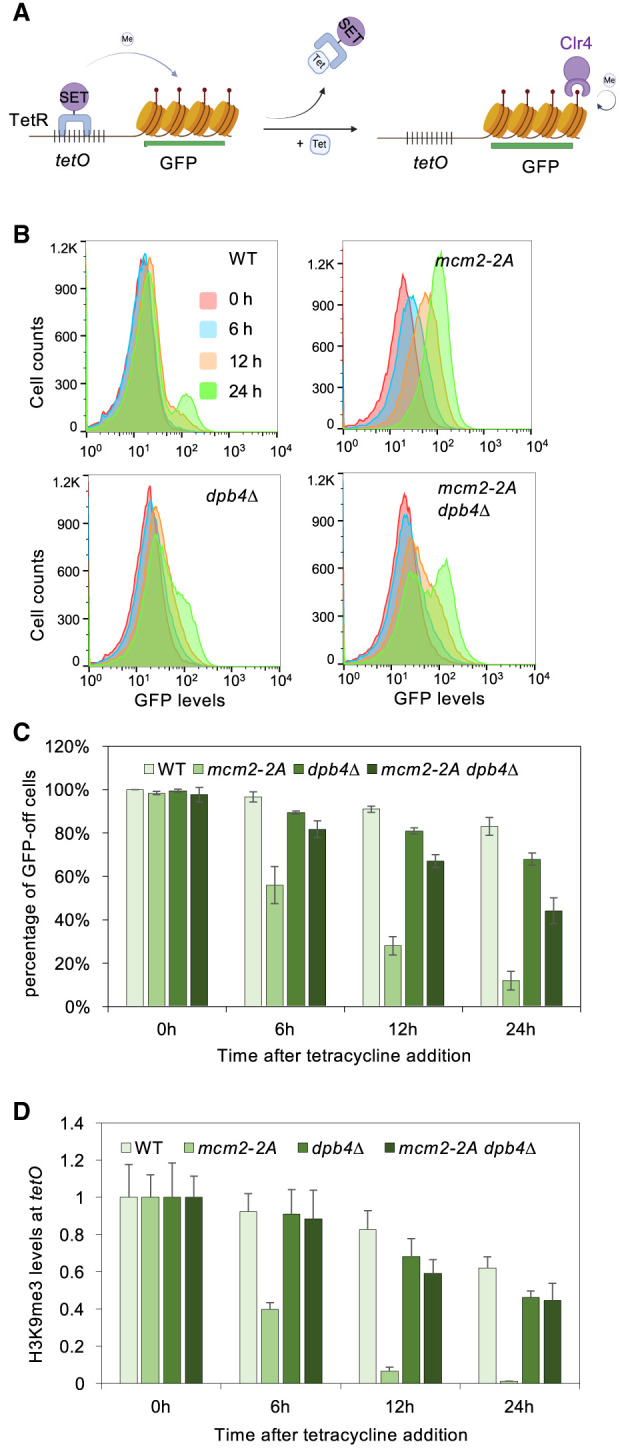
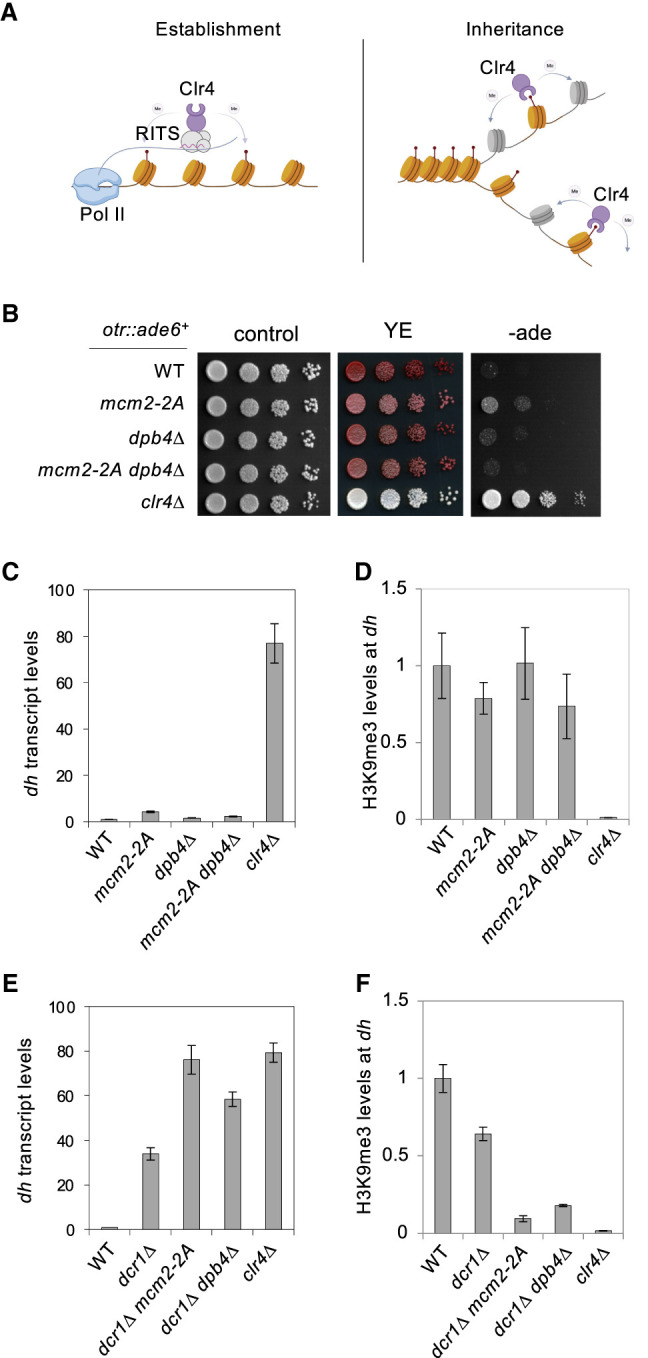
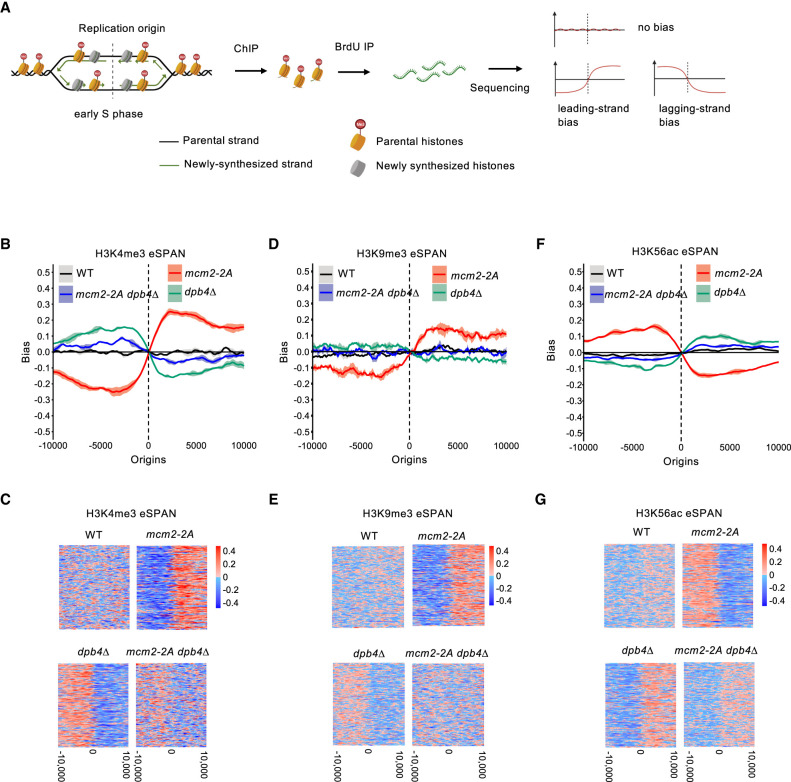
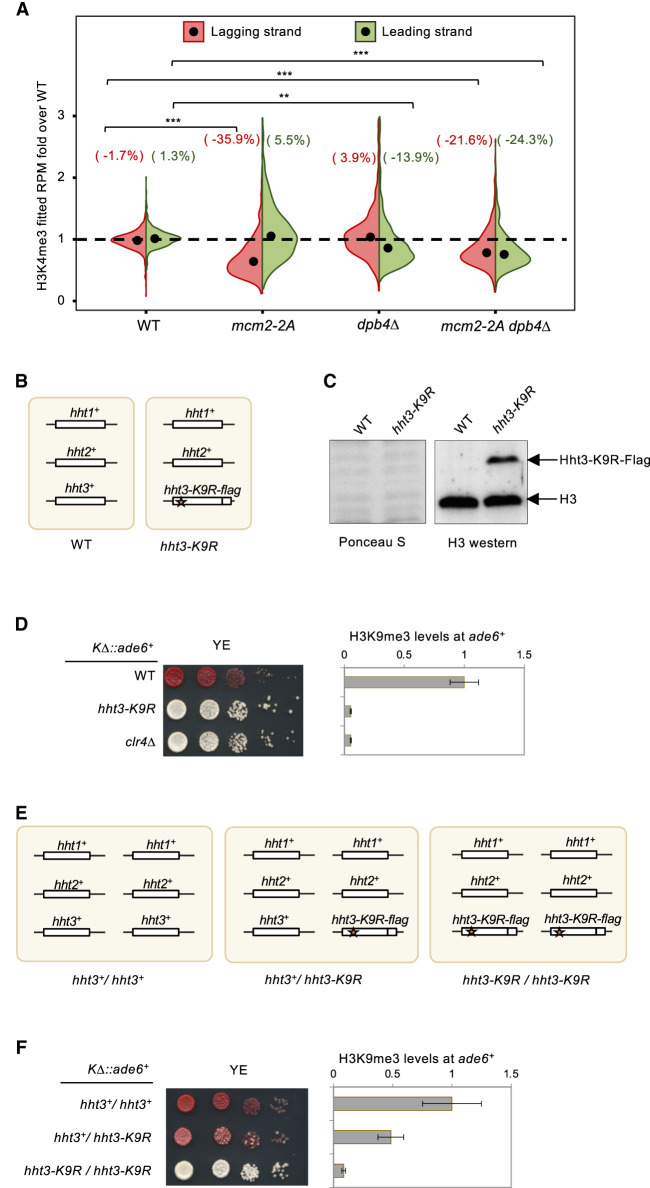
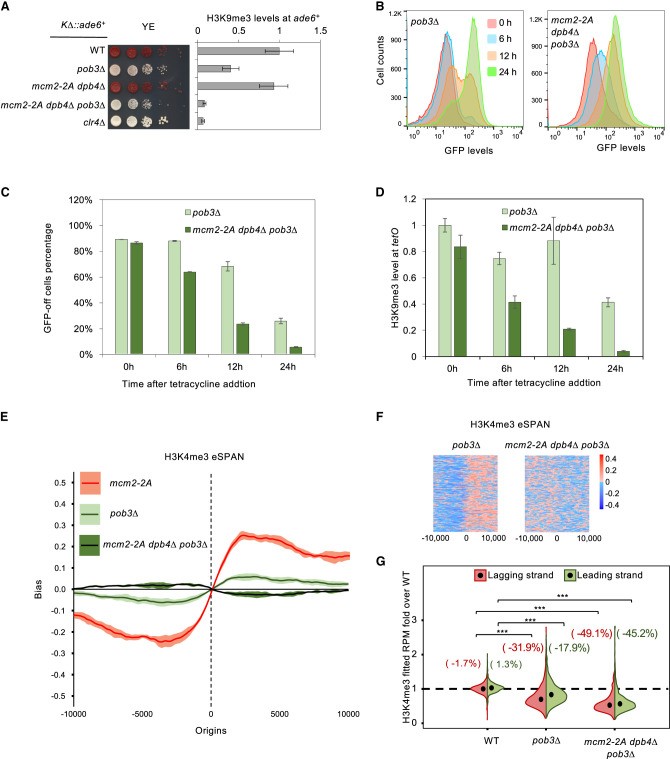
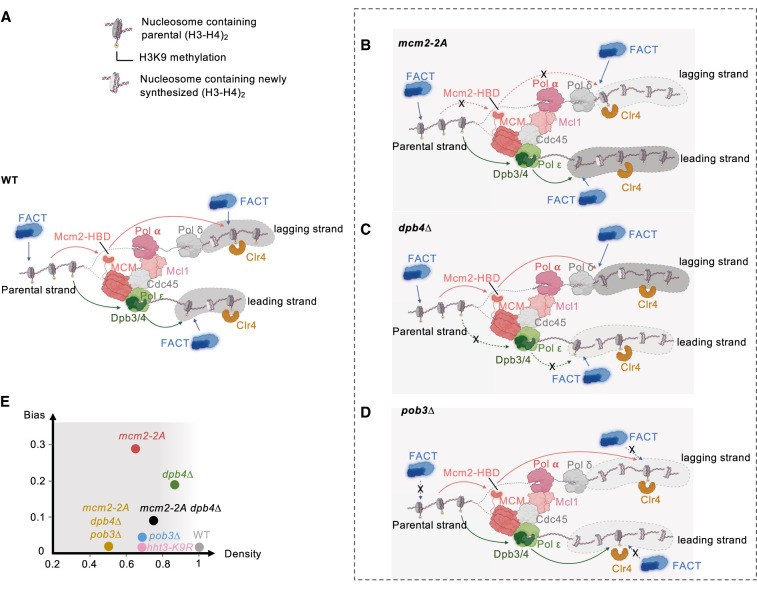
Chromatin-based epigenetic memory relies on the accurate distribution of parental histone H3-H4 tetramers to newly replicated DNA strands. Mcm2, a subunit of the replicative helicase, and Dpb3/4, subunits of DNA polymerase ε, govern parental histone H3-H4 deposition to the lagging and leading strands, respectively. However, their contribution to epigenetic inheritance remains controversial. Here, using fission yeast heterochromatin inheritance systems that eliminate interference from initiation pathways, we show that a Mcm2 histone binding mutation severely disrupts heterochromatin inheritance, while mutations in Dpb3/4 cause only moderate defects. Surprisingly, simultaneous mutations of Mcm2 and Dpb3/4 stabilize heterochromatin inheritance. eSPAN (enrichment and sequencing of protein-associated nascent DNA) analyses confirmed the conservation of Mcm2 and Dpb3/4 functions in parental histone H3-H4 segregation, with their combined absence showing a more symmetric distribution of parental histone H3-H4 than either single mutation alone. Furthermore, the FACT histone chaperone regulates parental histone transfer to both strands and collaborates with Mcm2 and Dpb3/4 to maintain parental histone H3-H4 density and faithful heterochromatin inheritance. These results underscore the importance of both symmetric distribution of parental histones and their density at daughter strands for epigenetic inheritance and unveil distinctive properties of parental histone chaperones during DNA replication.

Keywords: Dpb3; Dpb4; H3K9 methylation; Mcm2; eSPAN; epigenetic inheritance; fission yeast; heterochromatin; histone chaperone; parental histone density.


Figures

Figure 1.
Figure 1.
Mcm2 and Dpb3/4 regulate the inheritance of mating-type region heterochromatin. (A) Schematic diagram of parental histone H3–H4 segregation pathways during DNA replication. (B) Schematic diagram of the KΔ::ade6+ reporter. (C) Serial dilution analysis of the indicated strains to measure the expression of KΔ::ade6+. (D) qRT-PCR analyses of ade6+ transcript levels, normalized to act1+. Data are presented as mean ± SD of three technical replicates. (E) ChIP-qPCR analysis of H3K9me3 level at KΔ::ade6+, normalized to act1. Data are presented as mean ± SD of three technical replicates.
Figure 2.
Figure 2.
Mcm2 and Dpb4 regulate the inheritance of an ectopic heterochromatin. (A) Schematic diagram of the tetO-gfp+ reporter. (B) Flow cytometry analysis of GFP expression at different time points after tetracycline addition. All strains used are in an epe1Δ background. (C) Quantification of the percentage of cells maintaining low GFP expression at different time points after tetracycline addition. Data are presented as mean ± SD of two biological replicates. All strains are in an epe1Δ background. (D) ChIP-qPCR analysis of H3K9me3 levels at tetO binding sites at different time points after tetracycline addition, normalized to act1. Data are presented as mean ± SD of three technical replicates. All strains are in an epe1Δ background.
Figure 3.
Figure 3.
Mcm2 and Dpb4 cooperate with RNAi to regulate pericentric heterochromatin. (A) Schematic diagram of heterochromatin establishment and inheritance pathways at the pericentric region. (B) Serial dilution analysis of the indicated strains to measure the expression of otr::ade6+. (C,E) qRT-PCR analysis of dh transcript levels, normalized to act1+. Data are presented as mean ± SD of three technical replicates. (D,F) ChIP-qPCR analysis of H3K9me3 level at dh, normalized to leu1. Data are presented as mean ± SD of three technical replicates.
Figure 4.
Figure 4.
Mcm2 and Dpb4 regulate parental histone H3–H4 deposition at the replication fork. (A) Schematic diagram of eSPAN workflow and expected results. (B,D,F) eSPAN analysis of H3K4me3, H3K9me3, or H3K56ac bias levels at replication origins. The shading of the bias line plot is the 95% confidence interval of mean value of at least two biological replicates, which is mean ± twofold of the standard error. (C,E,G) Heat maps of H3K4me3, H3K9me3, and H3K56 eSPAN bias at each of the 162 replication origins analyzed.
Figure 5.
Figure 5.
Maintaining parental histone H3–H4 density on daughter strands during DNA replication is critical for epigenetic inheritance. (A) Violin plot of H3K4me3 density on the leading and lagging strands at replication origins. Data are the average of at least two biological repeats for each genotype. The numbers represent change over WT for each strand. (B,E) Diagram of histone H3 genes and the hht3-K9R mutation. (C, left) Ponceau S stain of the membrane used for Western blot analysis. (Right) Western blot analysis of histone H3 levels in cell extracts. Hht3-K9R has a FLAG tag at its C terminus, resulting in a higher molecular weight. (D,F, left) Serial dilution analysis of the indicated strains to measure the expression of KΔ::ade6+. (Right) ChIP analysis of H3K9me3 levels at KΔ::ade6+, normalized to leu1. Data are presented as mean ± SD of three technical replicates.
Figure 6.
Figure 6.
FACT regulates parental histone deposition and heterochromatin inheritance. (A, left) Serial dilution analysis of the indicated genotypes to measure the expression of KΔ::ade6+. (Right) ChIP-qPCR analysis of H3K9me3 levels KΔ::ade6+, normalized to leu1. Data are presented as mean ± SD of three technical replicates. (B) Flow cytometry analysis of GFP expression at different time points after tetracycline addition. All strains are in an epe1Δ background. (C) Quantification of the percentage of cells maintaining low GFP expression at different time points after tetracycline addition. Data are presented as mean ± SD of two biological replicates. All strains are in an epe1Δ background. (D) ChIP-qPCR analysis of H3K9me3 levels at tetO at different time points after tetracycline addition, normalized to leu1. Data are presented as mean ± SD of three technical replicates. All strains are in an epe1Δ background. (E) eSPAN analysis of H3K4me3 bias levels at replication origins of the indicated strains. The shading of the bias line plot is the 95% confidence interval of mean value of at least two biological replicates, which is approximately mean ± twofold of the standard error. (F) Heat maps of H3K4me3 bias at each of the 162 replication origins analyzed. (G) Violin plot of H3K4me3 density on leading and lagging strands at replication origins. Data are the average of at least two biological repeats for each genotype. The numbers represent changes over WT for each strand.
Figure 7.
Figure 7.
Model of the cooperation of histone chaperones in regulating parental histone segregation to daughter DNA strands and epigenetic inheritance of heterochromatin. (A) Schematic diagram illustrating parental histone H3–H4 deposition pathways during DNA replication in wild-type cells. (B) Impaired parental histone H3–H4 deposition to the lagging strand in mcm2-2A cells leads to a high H3K4me3 eSPAN bias and low H3K4me3 density on the lagging strand. (C) Impaired parental histone H3–H4 deposition to the leading strand in dpb4Δ cells results in an intermediate H3K4me3 eSPAN bias and a moderate decrease in H3K4me3 density on the leading strand. (D) Impaired parental histone H3–H4 deposition to both strands in pob3Δ cells causes a low H3K4me3 eSPAN bias and reduced H3K4me3 density on both daughter strands. (E) Plotting H3K4me3 eSPAN bias and H3K4me3 density on the lower-density strand. The gradients of gray indicate the severity of the silencing defects.

Similar articles

Cited by

References

    1. Allshire RC, Madhani HD. 2018. Ten principles of heterochromatin formation and function. Nat Rev Mol Cell Biol 19: 229–244. 10.1038/nrm.2017.119 - DOI - PMC - PubMed
    1. Audergon PN, Catania S, Kagansky A, Tong P, Shukla M, Pidoux AL, Allshire RC. 2015. Epigenetics. Restricted epigenetic inheritance of H3K9 methylation. Science 348: 132–135. 10.1126/science.1260638 - DOI - PMC - PubMed
    1. Aygün O, Mehta S, Grewal SI. 2013. HDAC-mediated suppression of histone turnover promotes epigenetic stability of heterochromatin. Nat Struct Mol Biol 20: 547–554. 10.1038/nsmb.2565 - DOI - PMC - PubMed
    1. Bannister AJ, Zegerman P, Partridge JF, Miska EA, Thomas JO, Allshire RC, Kouzarides T. 2001. Selective recognition of methylated lysine 9 on histone H3 by the HP1 chromo domain. Nature 410: 120–124. 10.1038/35065138 - DOI - PubMed
    1. Cutter DiPiazza AR, Taneja N, Dhakshnamoorthy J, Wheeler D, Holla S, Grewal SIS. 2021. Spreading and epigenetic inheritance of heterochromatin require a critical density of histone H3 lysine 9 tri-methylation. Proc Natl Acad Sci 118: e2100699118. 10.1073/pnas.2100699118 - DOI - PMC - PubMed

Publication types

MeSH terms