

In-depth multiomic characterization of the effects of obesity in high-fat diet-fed mice
- PMID: 38479983
- PMCID: PMC11073502
- DOI: 10.1002/2211-5463.13788
In-depth multiomic characterization of the effects of obesity in high-fat diet-fed mice
Erratum in
-
Correction to 'In-depth multiomic characterization of the effects of obesity in high-fat diet-fed mice'.FEBS Open Bio. 2025 Jul 30. doi: 10.1002/2211-5463.70095. Online ahead of print. FEBS Open Bio. 2025. PMID: 40735775 No abstract available.
Abstract
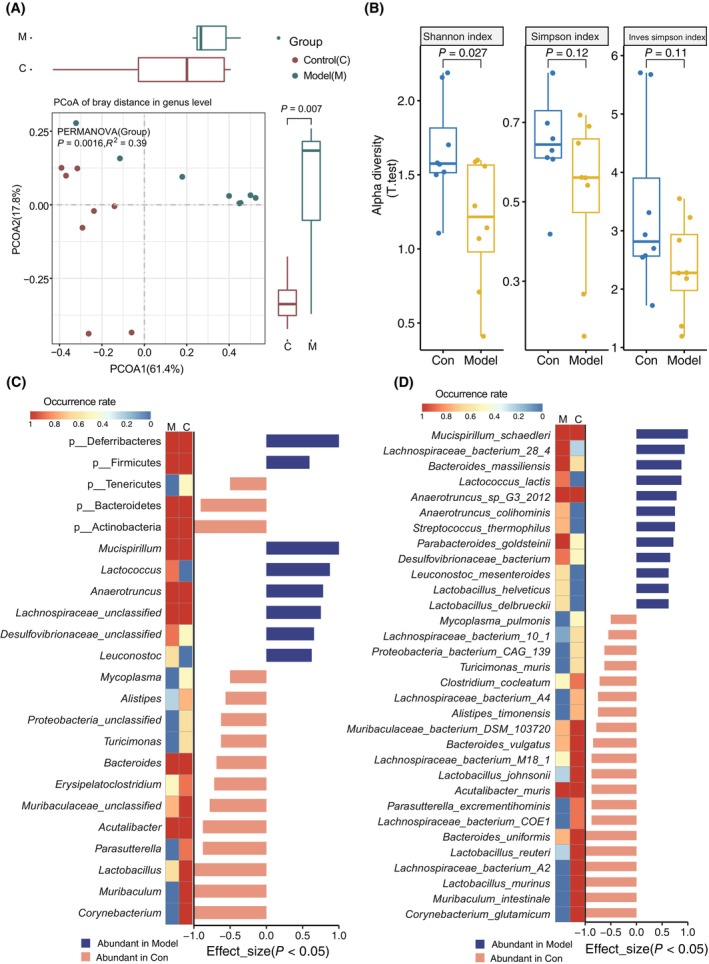
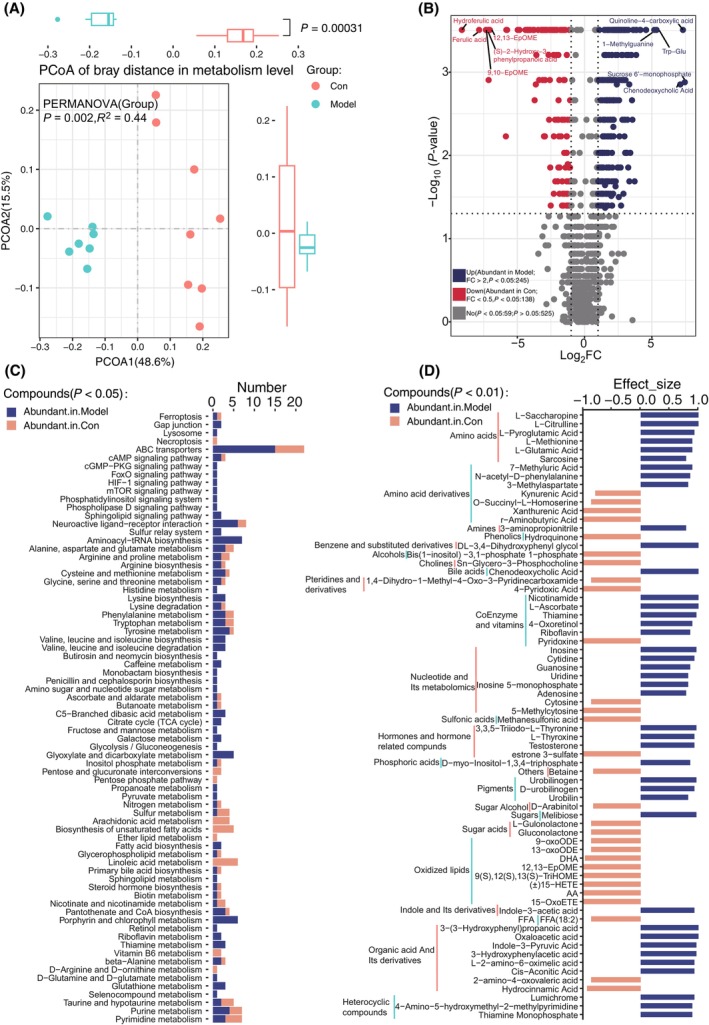
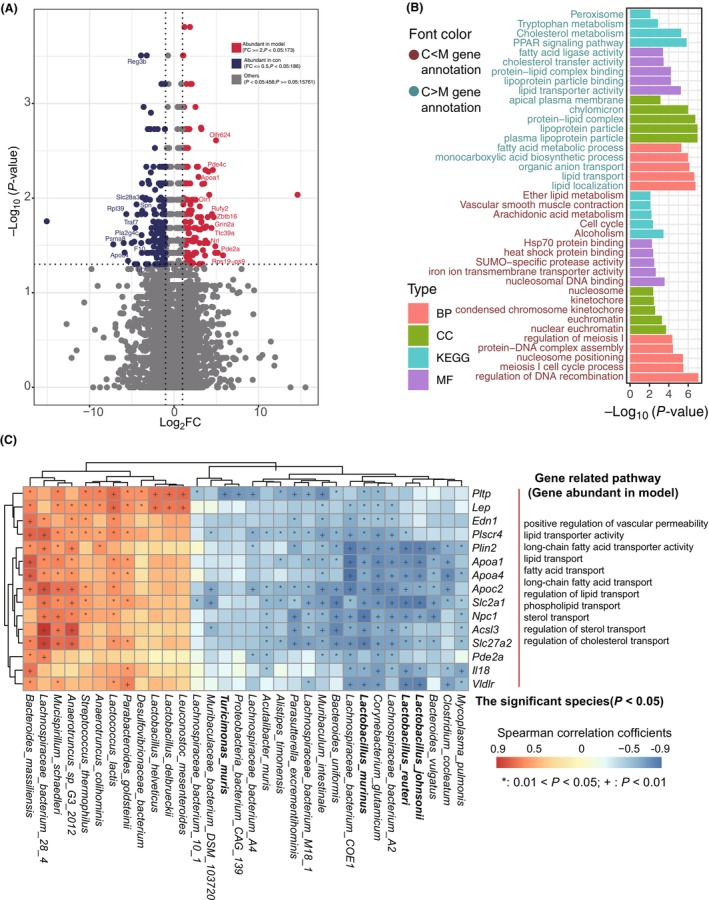
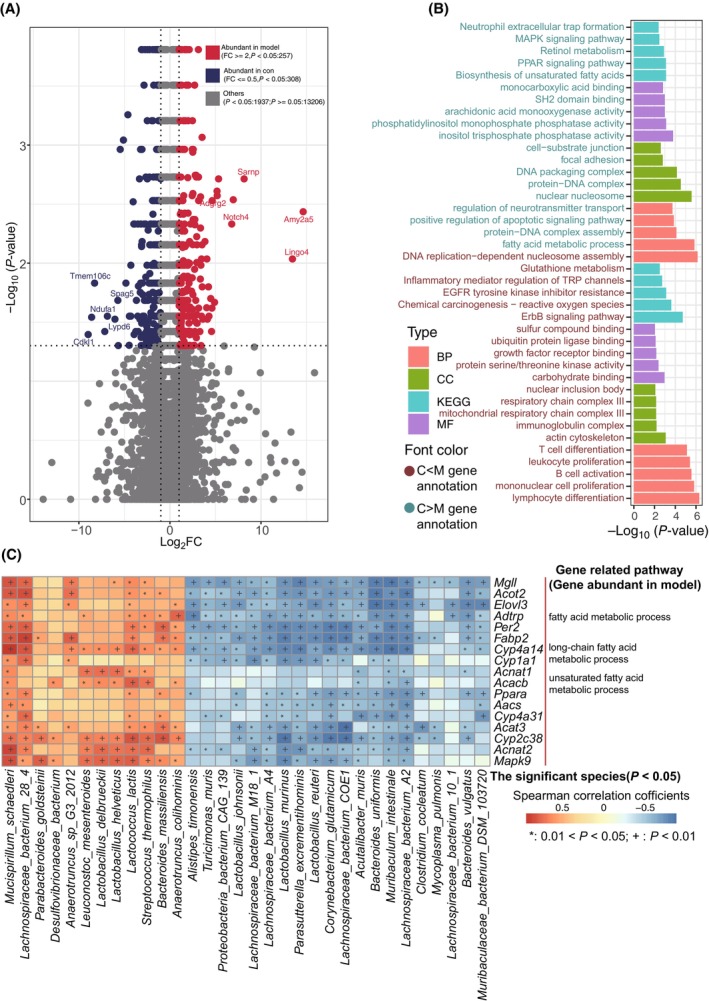
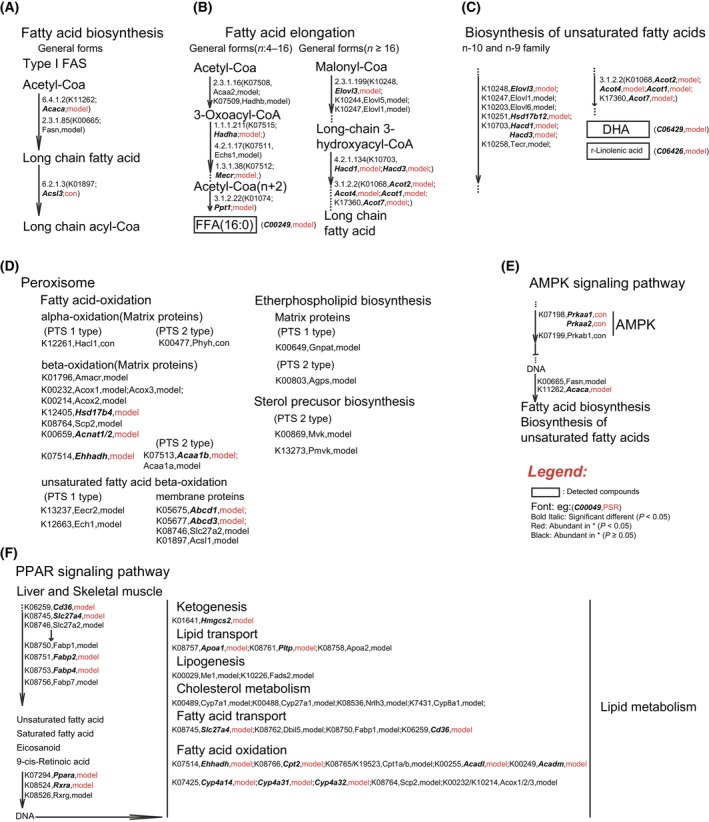
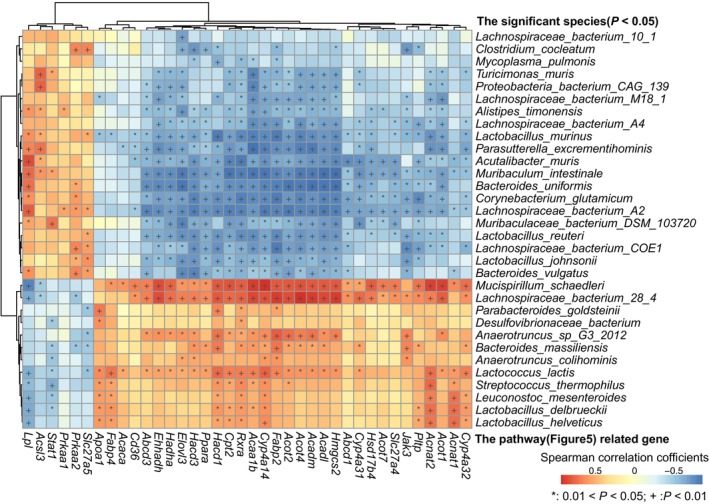
High-fat diet (HFD)-fed mice have been widely used in the clinical investigation of obesity. However, the long-term effect of HFD on gut microbiota and metabolites, plasma and liver metabolomics, colonic and liver transcriptomics remain largely unknown. In this study, 6-week-old C57BL/6J male mice fed with HFD for 14 weeks showed increased obesity-related indexes including alanine aminotransferase, aspartate aminotransferase, total cholesterol, total triglyceride, free fatty acids, lipopolysaccharides, IL-6, and TNFα. Furthermore, microbial diversity and richness were also significantly decreased. In the colon, genes involved in tryptophan metabolism, PPAR signaling pathway, cholesterol metabolism, and lipid localization and transport, were upregulated. While in the liver, MAPK signaling and unsaturated fatty acid biosynthesis were upregulated. Metabolomic analyses revealed decreased levels of glycerophospholipids and fatty acyl, but increased amino acids, coenzymes and vitamins, and organic acids in the colon, suggesting high absorption of oxidized lipids, while acyl-carnitine, lysophosphatidylcholine, lysophosphatidylethanolamine, and oxidized lipids were reduced in the liver, suggesting a more active lipid metabolism. Finally, correlation analyses revealed a positive correlation between gut microbiota and metabolites and the expression of genes associated with lipid localization, absorption, and transport in the colon, and nutrients and energy metabolism in the liver. Taken together, our results provide a comprehensive characterization of long-term HFD-induced obesity in mice.
Keywords: colonic gene expression; gut microbiome; high‐fat diet‐fed obesity; liver‐specific gene expression; metabolomics; multiomics.
© 2024 The Authors. FEBS Open Bio published by John Wiley & Sons Ltd on behalf of Federation of European Biochemical Societies.
Conflict of interest statement
The authors declare no conflict of interest.
Figures
Similar articles
-
Untargeted metabolomics reveals the inhibition effect of a high-fat diet on colorectal cancer tumorigenesis in obesity-resistant mice via regulating bile acid, glutathione, and glycerophospholipid metabolisms.Food Funct. 2025 Jul 1;16(13):5526-5542. doi: 10.1039/d4fo06132b. Food Funct. 2025. PMID: 40525498
-
The role of gut microbiota in Tirzepatide-mediated alleviation of high-fat diet-induced obesity.Eur J Pharmacol. 2025 Sep 5;1002:177827. doi: 10.1016/j.ejphar.2025.177827. Epub 2025 Jun 12. Eur J Pharmacol. 2025. PMID: 40516844
-
Probiotic Potentials and Protective Effects of Ligilactobacillus animalis LA-1 Against High-Fat Diet-Induced Obesity in Mice.Nutrients. 2025 Jul 17;17(14):2346. doi: 10.3390/nu17142346. Nutrients. 2025. PMID: 40732971 Free PMC article.
-
Dietary Branched-Chain Amino Acids Restriction in High-Fat Diet-Induced Obese Mice: Effects on Metabolic Homeostasis, Adipose Inflammation, and Gut Microbiota.J Nutr. 2025 Aug;155(8):2700-2710. doi: 10.1016/j.tjnut.2025.05.049. Epub 2025 Jun 20. J Nutr. 2025. PMID: 40545141
-
[Effect of Wenpi Pills on lipid metabolism in mice with non-alcoholic fatty liver disease induced by various diets].Zhongguo Zhong Yao Za Zhi. 2025 May;50(10):2730-2739. doi: 10.19540/j.cnki.cjcmm.20250120.401. Zhongguo Zhong Yao Za Zhi. 2025. PMID: 40686142 Chinese.
Cited by
-
Increase in body weight is lowered when mice received fecal microbiota transfer from donor mice treated with the AT1 receptor antagonist telmisartan.Front Pharmacol. 2024 Nov 18;15:1453989. doi: 10.3389/fphar.2024.1453989. eCollection 2024. Front Pharmacol. 2024. PMID: 39624839 Free PMC article.
References
Publication types
MeSH terms
Grants and funding
- LDSWZY202103/Foundation of Gansu Key Laboratory of Protection and Utilization for Biological Resources and Ecological Restoration in Longdong
- QY-STK-2023A-030/Science and Technology Program of Qingyang City
- QY2021A-F021/Science and Technology Program of Qingyang City
- 20230050038/Student Innovation and Entrepreneurship Action Plan of Lanzhou University
- 81960165/National Natural Science Foundation of China
LinkOut - more resources
Full Text Sources
Medical
Molecular Biology Databases
