. 2024 May;115(5):1388-1404.
doi: 10.1111/cas.16128. Epub 2024 Mar 13.

Upregulation of HLA-II related to LAG-3+CD4+ T cell infiltration is associated with patient outcome in human glioblastoma

Affiliations

Upregulation of HLA-II related to LAG-3+CD4+ T cell infiltration is associated with patient outcome in human glioblastoma

Wenli Guo et al. Cancer Sci. 2024 May.

Erratum in

Abstract

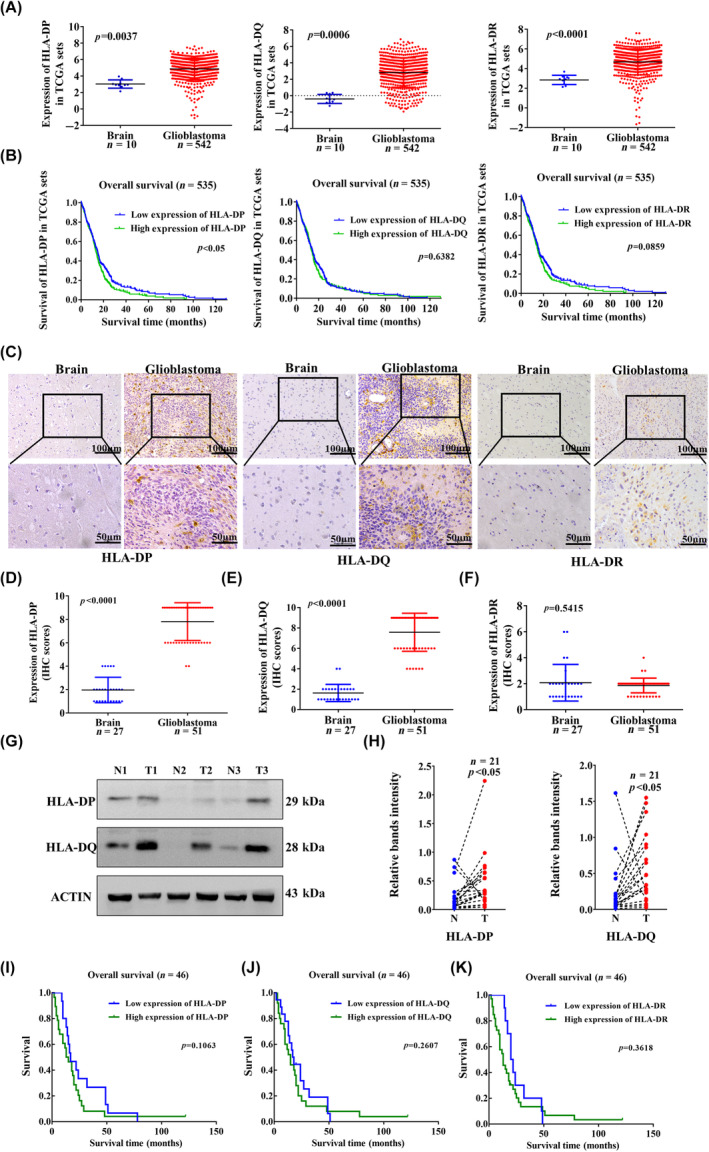
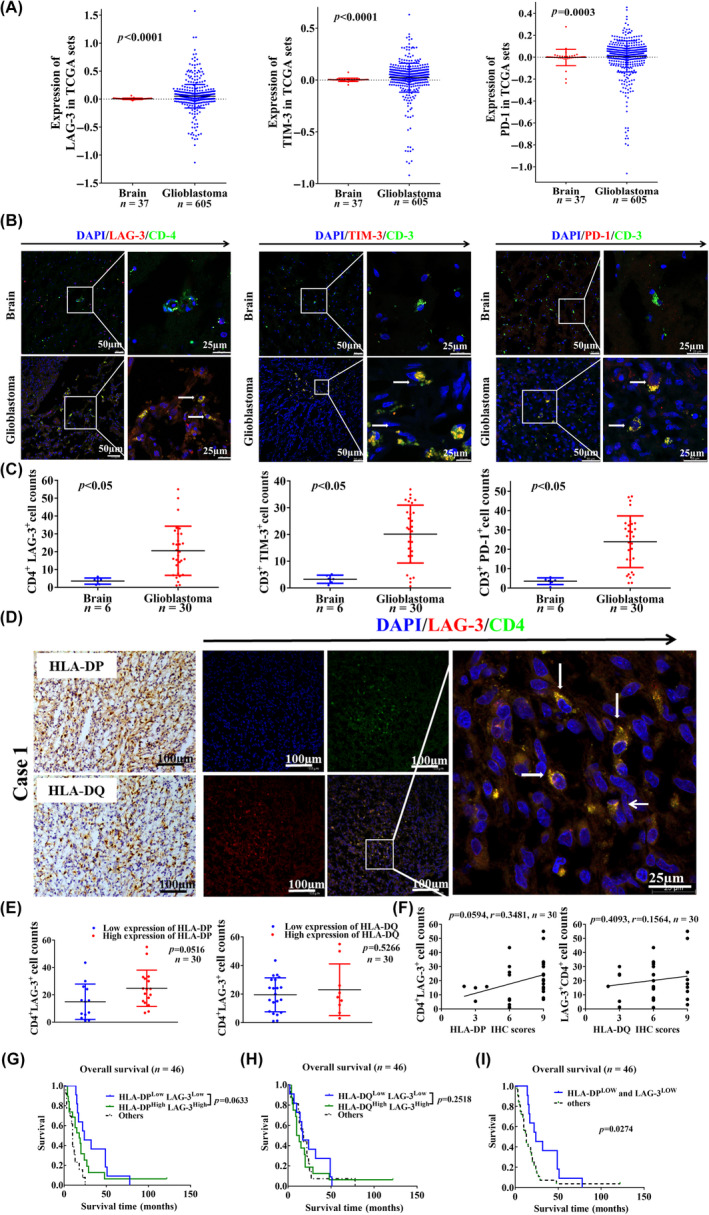
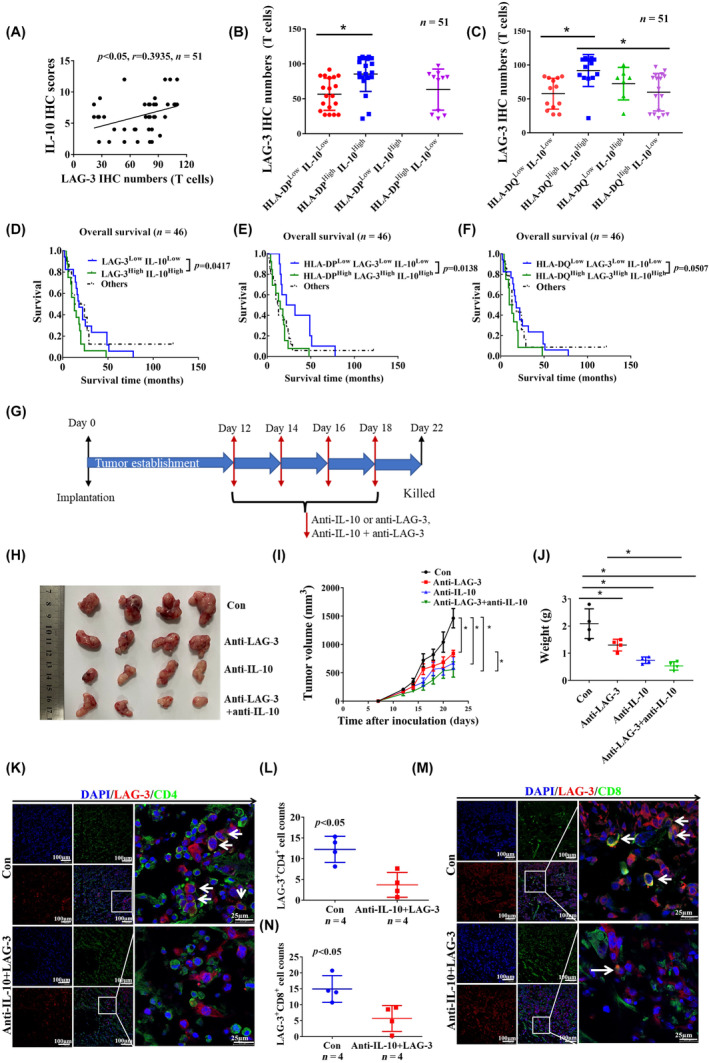
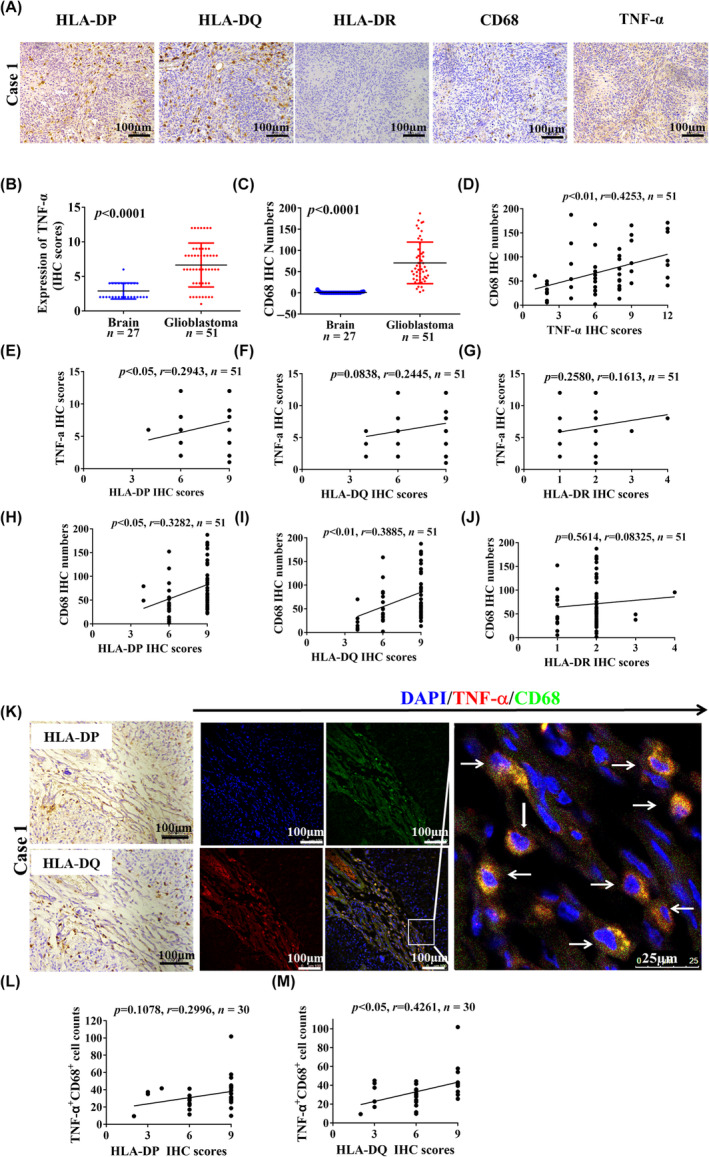
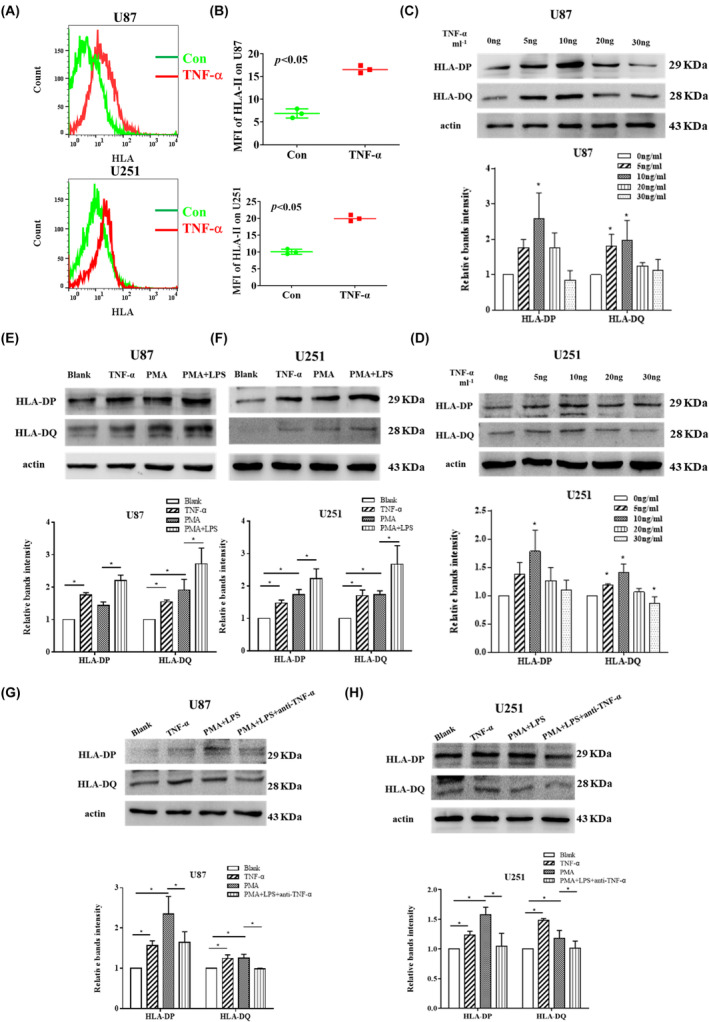
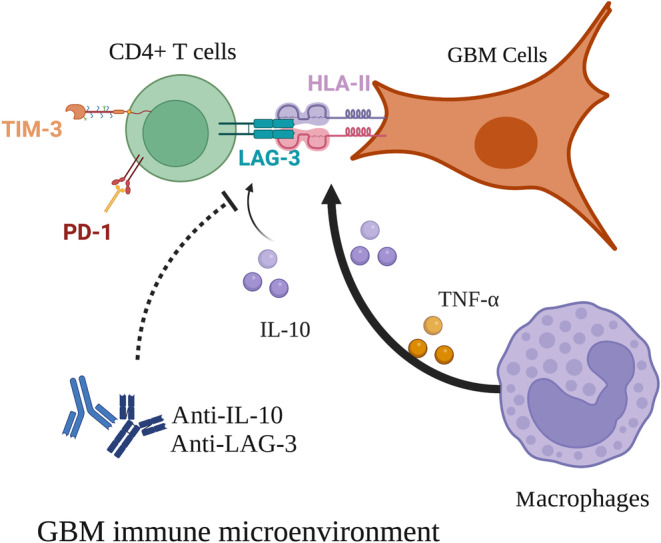
Glioblastoma (GBM) is the most common malignant diffuse glioma of the brain. Although immunotherapy with immune checkpoint inhibitors (ICIs), such as programmed cell death protein (PD)-1/PD ligand-1 inhibitors, has revolutionized the treatment of several cancers, the clinical benefit in GBM patients has been limited. Lymphocyte-activation gene 3 (LAG-3) binding to human leukocyte antigen-II (HLA-II) plays an essential role in triggering CD4+ T cell exhaustion and could interfere with the efficiency of anti-PD-1 treatment; however, the value of LAG-3-HLA-II interactions in ICI immunotherapy for GBM patients has not yet been analyzed. Therefore, we aimed to investigate the expression and regulation of HLA-II in human GBM samples and the correlation with LAG-3+CD4+ T cell infiltration. Human leukocyte antigen-II was highly expressed in GBM and correlated with increased LAG-3+CD4+ T cell infiltration in the stroma. Additionally, HLA-IIHighLAG-3High was associated with worse patient survival. Increased interleukin-10 (IL-10) expression was observed in GBM, which was correlated with high levels of HLA-II and LAG-3+ T cell infiltration in stroma. HLA-IIHighIL-10High GBM associated with LAG-3+ T cells infiltration synergistically showed shorter overall survival in patients. Combined anti-LAG-3 and anti-IL-10 treatment inhibited tumor growth in a mouse brain GL261 tumor model. In vitro, CD68+ macrophages upregulated HLA-II expression in GBM cells through tumor necrosis factor-α (TNF-α). Blocking TNF-α-dependent inflammation inhibited tumor growth in a mouse GBM model. In summary, T cell-tumor cell interactions, such as LAG-3-HLA-II, could confer an immunosuppressive environment in human GBM, leading to poor prognosis in patients. Therefore, targeting the LAG-3-HLA-II interaction could be beneficial in ICI immunotherapy to improve the clinical outcome of GBM patients.

Keywords: HLA‐II; IL‐10; LAG‐3; glioblastoma; immune checkpoint inhibitor.


Conflict of interest statement

The authors declare no conflict of interest.

Figures

FIGURE 1
FIGURE 1
Expression of human leukocyte antigen‐II (HLA‐II) molecules in human glioblastoma (GBM). (A) Evaluation of HLA‐II expression from The Cancer Genome Atlas (TCGA). (B) Association between HLA‐DP, HLA‐DQ, and HLA‐DR expression and survival follow‐up time in TCGA datasets. (C) Immunohistochemical (IHC) images indicate the expression of HLA‐II in paraffin GBM specimens. (D–F) Comparison of HLA‐II molecules expression in control and GBM samples was analyzed (51 cases of GBM and 27 control tissues). (G, H) Twenty‐one pairs of fresh tumor tissues and peritumoral brain tissues were collected, and the expression of HLA‐II was measured by western blot. The comparison of HLA‐II between GBM (T) and control (N) tissues is shown (n = 21). (I–K) Overall survival was measured according to the expression of HLA‐II in paraffin‐embedded GBM (n = 46).
FIGURE 2
FIGURE 2
Human leukocyte antigen‐II (HLA‐II) expression is related to the infiltration of lymphocyte‐activation gene 3 (LAG‐3)+CD4+ T cells in glioblastoma (GBM). (A) Evaluation of LAG‐3, T cell immunoglobulin domain and mucin domain‐3 (TIM‐3), and programmed cell death protein 1 (PD‐1) expression from the TCGA. (B) Thirty cases of frozen GBM samples and six cases of control brain samples were collected, and immunofluorescence staining showed that LAG‐3 was colocalized with CD4, and TIM‐3 and PD‐1 were colocalized with CD3 in the tumor stroma. White arrows indicate colocalized cells. (C) The number of LAG‐3+CD4+, TIM‐3+CD3+, and PD‐1+CD3+ cells in GBM and control samples is shown (p < 0.05). (D) Thirty cases of frozen GBM and six control samples were collected, and immunofluorescence staining indicated that LAG‐3+CD4+ cells in the tumor stroma, which is associated with HLA‐DP and HLA‐DQ expression. White arrows indicate colocalized cells. (E) The correlation between number of CD4+LAG‐3+ T cell infiltration and HLA‐DP is shown. (F) The correlation between HLA‐DP expression and the number of CD4+LAG‐3+ T cells is shown. (G, H) Based on both HLA‐II and LAG‐3 expression in paraffin‐embedded GBM specimens, overall survival was analyzed according to HLA‐IIHighLAG‐3High and HLA‐IILowLAG‐3Low (n = 46). (I) Kaplan–Meier curves for survival outcomes of patients are shown according to low expression of HLA‐DP and LAG‐3 (n = 46).
FIGURE 3
FIGURE 3
Human leukocyte antigen‐II (HLA‐II) molecules are related to the expression of interleukin‐10 (IL‐10) in glioblastoma (GBM). (A) Based on the RT‐PCR results of 21 pairs of fresh tumor tissues, the expression of HLA‐DP was upregulated in 13 cases of GBM, and HLA‐DQ was upregulated in 14 cases of GBM. (B, C) GBM cases were divided into HLA‐II upregulation and HLA‐II downregulation groups. The expression of IL‐10, transforming growth factor‐β (TGF‐β), and prostaglandin E2 (PGE2) in fresh GBM samples was compared between those two groups (p < 0.05). (D) Representative immunohistochemical (IHC) images show the expression of IL‐10 in paraffin‐embedded GBM specimens. (E) Expression of IL‐10 was compared between GBM and control specimens (p < 0.001). (F) Survival outcomes of patients were shown according to the expression of IL‐10 in paraffin GBM specimens. (G) Representative IHC images indicate the expression of HLA‐DP, HLA‐DQ, and IL‐10 in paraffin GBM specimens. (H, I) Spearman's correlation analysis indicates the relationship between the expression of HLA‐II and IL‐10 in paraffin GBM specimens (n = 51). (J, K) Survival outcomes of patients were shown according to both HLA‐II and IL‐10 expression in paraffin GBM specimens, HLA‐IILowIL‐10Low versus HLA‐IIHighIL‐10High (n = 46). N, Normal control brain; T, Tumor.
FIGURE 4
FIGURE 4
Targeting of lymphocyte‐activation gene 3 (LAG‐3) and interleukin‐10 (IL‐10) inhibits glioblastoma (GBM) progression. (A) Based on the immunohistochemical (IHC) staining in paraffin GBM specimens, the correlation between LAG‐3+ cell number and IL‐10 expression is shown (n = 51). (B, C) The number of LAG‐3+ cells in patients with human leukocyte antigen‐II (HLA‐II)HighIL‐10High was compared to that in patients with HLA‐IILowIL‐10Low (n = 51). (D) Survival outcomes of patients are shown according to both LAG‐3 and IL‐10 expression in paraffin‐embedded GBM specimens, LAG‐3LowIL‐10Low versus LAG‐3HighIL‐10High (n = 46). (E, F) Survival outcomes of patients are shown according to combined expression of HLA‐II, LAG‐3, and IL‐10 together in paraffin‐embedded GBM specimens, HLA‐IILowLAG‐3LowIL‐10Low versus HLA‐IIHighLAG‐3HighIL‐10High (n = 46). (G) Schematic of experimental design. (H) Images of tumors from control, anti‐IL‐10, anti‐LAG‐3, and anti‐IL‐10 + LAG‐3 groups are shown at day 22 after injection. (I) Tumor volumes were measured every 2 days from day 12 to 22. Data are shown as mean ± SD (n = 4). (J) Tumor weights were measured at day 22. Data are shown as mean ± SD (n = 4). (K, M) Immunofluorescence staining indicated that CD4+LAG‐3+ and CD8+LAG‐3+ cells were infiltrated in the tumor tissues. White arrows show colocalized cells. (L, N) Data are shown as mean ± SD (n = 4). *p < 0.05. Con, control; TNF‐α, tumor necrosis factor‐α.
FIGURE 5
FIGURE 5
Tumor necrosis factor‐α (TNF‐α)+CD68+ macrophage infiltration is associated with human leukocyte antigen‐II (HLA‐II) upregulation in glioblastoma (GBM). (A) Representative immunohistochemical (IHC) images indicate the expression of HLA‐ II, TNF‐α, and CD68 in the same field in paraffin‐embedded GBM samples. (B, C) Expression of TNF‐α and the CD68+ macrophage infiltration were compared between GBM and control specimens (p < 0.05). (D) Based on the IHC staining in paraffin‐embedded GBM samples, the correlation between CD68+ macrophage infiltration and TNF‐α expression is shown (n = 51). (E–G) Correlation between TNF‐α expression and HLA‐II expression (n = 51). (H–J) Correlation between CD68+ macrophage infiltration and HLA‐II expression (n = 51). (K) Immunofluorescence staining shows that TNF‐α and CD68 is colocalized in the tumor stroma, which is associated with HLA‐DP and HLA‐DQ expression in the same field. White arrows indicate colocalized cells. (L, M) Based on immunofluorescence staining of TNF‐α and CD68, the correlation between the number of infiltrated TNF‐α+CD68+ cells and HLA‐II expression is shown (n = 30).
FIGURE 6
FIGURE 6
THP‐1 macrophages secreting tumor necrosis factor‐α (TNF‐α) upregulate the expression of human leukocyte antigen (HLA)‐DP and HLA‐DQ in U87 and U251 cells. (A, B) U87 and U251 cells were treated with 10 ng/mL TNF‐α, and the expression of HLA‐DP and HLA‐DQ was measured by flow cytometry. Data were shown as mean ± SD (n = 3, *p < 0.05 vs. Control [Con]). (C, D) U87 and U251 cells were treated with different doses of TNF‐α, and the expression of HLA‐DP and HLA‐DQ was measured by western blot analysis. Data are shown as mean ± SD (n = 3, *p < 0.05 vs. Con). (E, F) The supernatant from phorbol 12‐myristate 13‐acetate (PMA)‐induced THP‐1 (M0) and lipopolysaccharide (LPS)‐activated PMA‐induced THP‐1 (M1) was collected to stimulate U87 and U251 cells, and the expression of HLA‐DP and HLA‐DQ were measured by western blot analysis. Data were shown as mean ± SD (n = 3, *p < 0.05). (G, H) Anti‐TNF‐α neutralizing Ab was used to neutralize the TNF‐α in the supernatant, and the expression of HLA‐DP and HLA‐DQ were measured by western blot. Data are shown as mean ± SD (n = 3, *p < 0.05). The experiments were repeated three times. MFI, mean fluorescence intensity.
FIGURE 7
FIGURE 7
Macrophages in the tumor microenvironment upregulated human leukocyte antigen‐II (HLA‐II) expression in glioblastoma (GBM) cells through tumor necrosis factor‐α (TNF‐α). HLA‐II interacted with lymphocyte‐activation gene 3 (LAG‐3) confers an immunosuppressive environment in GBM. Interleukin‐10 (IL‐10) could be a strong factor that promotes HLA‐II–LAG‐3‐induced CD4+ T cell exhaustion in GBM, leading to poor prognosis. PD‐1, programmed cell death protein 1; TIM‐3, T cell immunoglobulin domain and mucin domain‐3.

Similar articles

Cited by

References

    1. Tan AC, Ashley DM, López GY, Malinzak M, Friedman HS, Khasraw M. Management of glioblastoma: state of the art and future directions[J]. CA Cancer J Clin. 2020;70(4):299‐312. - PubMed
    1. Cloughesy TF, Mochizuki AY, Orpilla JR, et al. Neoadjuvant anti‐PD‐1 immunotherapy promotes a survival benefit with intratumoral and systemic immune responses in recurrent glioblastoma[J]. Nat Med. 2019;25(3):477‐486. - PMC - PubMed
    1. Quail DF, Joyce JA. The microenvironmental landscape of brain tumors[J]. Cancer Cell. 2017;31(3):326‐341. - PMC - PubMed
    1. Fu W, Wang W, Li H, et al. Single‐cell atlas reveals complexity of the immunosuppressive microenvironment of initial and recurrent glioblastoma[J]. Front Immunol. 2020;11:835. - PMC - PubMed
    1. Broekman ML, Maas SLN, Abels ER, Mempel TR, Krichevsky AM, Breakefield XO. Multidimensional communication in the microenvirons of glioblastoma[J]. Nat Rev Neurol. 2018;14(8):482‐495. - PMC - PubMed

MeSH terms