. 2024 Mar 13;15(1):2269.
doi: 10.1038/s41467-024-46354-0.

Biallelic NAA60 variants with impaired n-terminal acetylation capacity cause autosomal recessive primary familial brain calcifications

Viorica Chelban #  1   2 Henriette Aksnes #  3 Reza Maroofian  4 Lauren C LaMonica  5 Luis Seabra  6 Anette Siggervåg  7 Perrine Devic  8 Hanan E Shamseldin  9 Jana Vandrovcova  4 David Murphy  10 Anne-Claire Richard  11 Olivier Quenez  11 Antoine Bonnevalle  11 M Natalia Zanetti  12 Rauan Kaiyrzhanov  4   13 Vincenzo Salpietro  4 Stephanie Efthymiou  4 Lucia V Schottlaender  4   14   15 Heba Morsy  4   16 Annarita Scardamaglia  4 Ambreen Tariq  4 Alistair T Pagnamenta  17 Ajia Pennavaria  7 Liv S Krogstad  7 Åse K Bekkelund  7 Alessia Caiella  7 Nina Glomnes  7   18 Kirsten M Brønstad  7 Sandrine Tury  19 Andrés Moreno De Luca  20   21 Anne Boland-Auge  22 Robert Olaso  22 Jean-François Deleuze  22 Mathieu Anheim  23   24   25 Benjamin Cretin  23   24   25 Barbara Vona  26   27 Fahad Alajlan  28 Firdous Abdulwahab  9 Jean-Luc Battini  19 Rojan İpek  29 Peter Bauer  30 Giovanni Zifarelli  30 Serdal Gungor  31 Semra Hiz Kurul  32 Hanns Lochmuller  33   34   35 Sahar I Da'as  36   37 Khalid A Fakhro  36   37   38 Alicia Gómez-Pascual  39 Juan A Botía  39 Nicholas W Wood  10   40 Rita Horvath  41 Andreas M Ernst  5   42 James E Rothman  5   12 Meriel McEntagart  43 Yanick J Crow  6   44 Fowzan S Alkuraya  9   45 Gaël Nicolas  11 SYNaPS Study GroupThomas Arnesen  46   47 Henry Houlden  48   49
Collaborators, Affiliations

Biallelic NAA60 variants with impaired n-terminal acetylation capacity cause autosomal recessive primary familial brain calcifications

Viorica Chelban et al. Nat Commun. .

Abstract

Primary familial brain calcification (PFBC) is characterized by calcium deposition in the brain, causing progressive movement disorders, psychiatric symptoms, and cognitive decline. PFBC is a heterogeneous disorder currently linked to variants in six different genes, but most patients remain genetically undiagnosed. Here, we identify biallelic NAA60 variants in ten individuals from seven families with autosomal recessive PFBC. The NAA60 variants lead to loss-of-function with lack of protein N-terminal (Nt)-acetylation activity. We show that the phosphate importer SLC20A2 is a substrate of NAA60 in vitro. In cells, loss of NAA60 caused reduced surface levels of SLC20A2 and a reduction in extracellular phosphate uptake. This study establishes NAA60 as a causal gene for PFBC, provides a possible biochemical explanation of its disease-causing mechanisms and underscores NAA60-mediated Nt-acetylation of transmembrane proteins as a fundamental process for healthy neurobiological functioning.


Conflict of interest statement

P.D. is an orator and scientific board member for Gilead and an orator for Novartis. All other authors declare no competing interests.

Figures
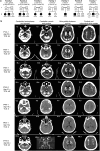
Fig. 1
Fig. 1. NAA60 biallelic variants lead to primary familial brain calcifications.
a Pedigrees of the families with NAA60 biallelic variants identified in this study. b CT scan axial views illustrating brain calcification in patients with NAA60 biallelic variants. Image VII.b shows CT angiography of the brain revealing multifocal narrowing of the distal intracranial arteries, compatible with an intracranial vasculopathy likely secondary to intravascular calcium deposition. TCS total calcification score.
Fig. 2
Fig. 2. NAA60 protein sequence and structural features predict functional implications of NAA60 variants.
a Alignment of the NAA60 amino acids corresponding to the GNAT fold across different species shows strong conservation of the regions affected by NAA60 variants found in PFBC cases of the seven families (Family 1–7). UNIPROT accession numbers: human, Q9H7X0; D. rerio (DANRE), A3KPA3; bovine (BOVIN), Q17QK9; mouse, Q9DBU2; rat, Q3MC1; D. melanogaster (DROME), Q95SX8. b Structure of wild-type NAA60 (PDB: 5ICV, amino acids 4–184 https://www.rcsb.org/structure/5icv) shown in gray from three different angles with the bound CoA-Ac-MKAV bisubstrate analog in stick representation. c PDB structure modified in PyMol to visualize the truncated proteins predicted from the PFBC NAA60 variants F1 and F2/3. The Ac-CoA motif is indicated in yellow. d PDB structure modified in PyMol to visualize the PFBC NAA60 missense variants in F4-F7. e Interaction figures derived from DynaMut predictions displaying interaction forces between the mutated residues in F4-F7 and surrounding residues.
Fig. 3
Fig. 3. Mutated NAA60 proteins fail to associate with the Golgi, are highly unstable and lack intrinsic enzymatic activity.
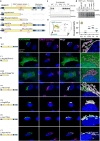
a Predicted proteins resulting from the PFBC variants in NAA60 described here. WT NAA60 contains 242 amino acid (aa) residues and is part of the N-terminal acetyltransferase (NAT) family. These proteins share a distinct secondary structural GNAT domain (aa 13–182 of NAA60, indicated in yellow), comprising a critical binding site for the acetyl-CoA donor (aa 108–113 of NAA60, indicated in orange). In addition, NAA60 has a C-terminal extension unlike other NATs in which two Golgi membrane-binding amphipathic helices are found (aa 190–224, indicated in light blue). b FLAG-NAA60 wild-type and FLAG-NAA60-PFBC patient variants were expressed in RPE-1 cells, immunostained, and imaged with a Leica SP8 confocal microscope using the Lightning module for optimized resolution. The scale bar is 20 µm for all except for the magnified frames. Images are representative >100 transfected cells. c FLAG-NAA60 wild-type and FLAG-NAA60-PFBC variants were expressed in HEK293FT cells, and six hours prior to harvesting, cells were treated with 5 µM proteasomal inhibitor MG132. Result shown is representative of at least three independent experiments. d The indicated cells were lysed and endogenous NAA60 levels were assessed by western blot. HAP1 Ctrl and NAA60 KO cells were used as control for the antibody. Lym. = primary lymphoblasts. Fibroblasts = primary dermal fibroblasts. Representative of three experiments. e NAA60 variant proteins lack intrinsic enzymatic activity. WT and variant constructs were expressed in HEK293T cells and immunoprecipitated (IP) to produce the proteins for an enzyme activity test as illustrated. NAA60 IP products were tested for their ability to Nt-acetylate the NAA60-type substrate peptide MAPL in a classical in vitro [14 C] Nt-acetylation assay. For each condition, at least three independent replica experiments were included (n = 3 for F1 and F2/3, n = 9 for F4 and F5), pretests were performed to be able to apply equal enzyme inputs, and a final normalization to enzyme input was performed. **** indicates p < 0.0001 by impaired two-tailed t-test with Welch’s correction testing each mutant against the WT. Source data are provided in the Source Data file. Parts of the figure were drawn by using elements modified with text, markings, and annotations from Servier Medical Art, provided by Servier, licensed under a Creative Commons Attribution 3.0 (https://creativecommons.org/licenses/by/3.0/).
Fig. 4
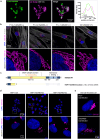
Fig. 4. NAA60 knockdown but not NAA60 knockout cells have Golgi fragmentation.
a NAA60-FLAG-positive compartments localized close to compartments stained by the cis-Golgi marker GM130 but did not perfectly colocalize. HeLa cells were transfected with FLAG-NAA60, fixed, and stained with anti-FLAG and anti-GM130 followed by imaging using an OMX 3D-SIM microscope. Images are shown as z-stack max intensity projection and are representative of <100 cells inspected. b Golgi fragmentation was not observed in fibroblast cells derived from Family 1. Cells were fixed and stained for the cis-Golgi marker GM130 and with DAPI for visualization of the nucleus and phalloidin for F-actin. Imaging was performed with a Leica SP8 using the Lightning module for deconvolution and optimized resolution. Representative of at least three independent experiments. The scale bar is 20 µm for all except for the magnified frames. c Schematic overview of the predicted protein resulting from the frameshift introduced in HAP1 NAA60 KO cells. Compare to the PFBC variants shown in Fig. 2a. d Golgi fragmentation was not observed in HAP1 NAA60 knockout cells. Ploidy-controlled HAP1 CTRL, NAA60 knockout, and NAA80 knockout cells were fixed and stained for the cis-Golgi marker GM130 and with DAPI for visualization of the nucleus. NAA80 knockout was used as a positive control for Golgi fragmentation in the HAP1 cell line. The scale bar is 25 µm for all images on top and 5 µm for all images at the bottom. e Dermal fibroblast healthy control cells were transfected with shNAA60+RFP plasmid 72 h prior to fixation. Images were acquired with a Leica TCS SP8 confocal microscope at 100x using a zoom factor of 0.75 and a z-step size of 0.25 μm. The scale bar is 5 µm for both images shown. The degree of Golgi intactness was evaluated by microscopy using a Leica DMI6000 B wide-field fluorescence microscope with an HCX PL APO 100 × 1.4 NA oil objective. Images are representative of at least 100 inspected cells (HAP1) and at least 30 transfection-positive dermal fibroblast cells where near all transfected cells had the phenotype.
Fig. 5
Fig. 5. Nt-acetylation assay of peptides involved in PFBC shows that SLC20A2 is the best substrate among them.
a Schematic representation of the in vitro DTNB enzyme activity test towards peptides representing the N-termini of PFBC-connected proteins. NAA60 was expressed and purified from E. coli and mixed with various peptides in acetylation buffer. b NAA60 was tested towards the classic NAA60 substrate MDEL as a positive control as well as classic NAA10 and NAA80 peptides as negative controls alongside the N-termini of PFBC-connected proteins. All peptides, except MAMD and MLQN, were significantly different from the positive control by two-tailed t test (p values ranging from 0.0088 to 0.011, exact p values are provided in the Source Data file). Mean from n = 3 independent experiments is shown, and error bars represent SD. c NAA60 was tested towards the classic NAA10, NAA20, NAA80 and NAA60 substrates in addition to full and potential iMet-processed SLC20A2 N-termini. All peptides, except the MAMD (SLC20A2), were significantly different from the positive control by two-tailed t test (p values ranging from 0.0001–0.02, exact p values are provided in the Source Data file). Mean from n = 3 independent experiments is shown, and error bars represent SD. Parts of the figure were drawn by using elements modified with text, markings, and annotations from Servier Medical Art, provided by Servier, licensed under a Creative Commons Attribution 3.0 (https://creativecommons.org/licenses/by/3.0/).
Fig. 6
Fig. 6. NAA60-related disease mechanisms involve impaired cellular phosphate homeostasis, possibly via SLC20A2.
a Representation of sulfo-NHS-biotin labeling and pulldown to isolate plasma membrane (PM) proteins. b Western blot from human fibroblasts subjected to sulfo-NHS-biotin labeling and pulldown. c Quantification of b, in affected cases (F1-II-1 and F1-II-2), heterozygous unaffected carriers (F1-I-1), and control lines (** indicates p < 0.0005 by unpaired two-tailed t test with Welch’s correction (p = 0.0038 for case I against control  and p = 0.0026 for case II against control). The results were compared to endogenous actin levels. Mean from n = 3 independent pulldowns and error bars represent SD. d Representation of the assay assessing depletion of inorganic phosphate (Pi) from culture medium. e Quantification of [Pi] in culture medium of fibroblasts from cases with variants in NAA60, SLC20A2, and healthy controls after 3 days of incubation (T1). Mean from n = 3 independent experiments shown, error bars represent SD, and * indicates p < 0.05 by unpaired two-tailed t test with Welch’s correction (p = 0.0423). e’ [Pi] depletion from T0 to T1 in fibroblast culture as in e, showing higher depletion in control (43.3%) than in NAA60 mutant culture medium (7.9%), indicating a 35.5% reduction in [Pi] uptake by NAA60 mutant fibroblasts. Mean from n = 3 independent experiments is shown, error bars represent SD, and * indicates p < 0.05 by unpaired two-tailed t test with Welch’s correction (p = 0.0423). f Efflux of 33Pi and f’ uptake of 33Pi from in PBMCs in healthy donor (Ctrl) and PFBC patient from F2 carrying the NAA60 c.338-1 G > C variant. Mean and SD from n = 6 independent experiments are shown, and * indicates p < 0.05 by unpaired two-tailed t test with Welch’s correction (p = 0.0253). g NAA60 and SCL20A2 genes module co-expression in the caudate tissue. Top–down plot of the blue and gray module genes in the caudate tissue. NAA60 module is highlighted in blue, SLC20A2 in gray. Size of gene nodes reflect their connectivity with the rest of genes in the module. Proximity of genes in the plot reflects their similarity in terms of shared connections with other genes. Error bars show SD. * indicates p < 0.05 by unpaired t test with Welch’s/correction. Source data are provided in the Source Data file. Parts of the figure were drawn by using elements modified with text, markings, and annotations from Servier Medical Art, provided by Servier, licensed under a Creative Commons Attribution 3.0 (https://creativecommons.org/licenses/by/3.0/).
Fig. 7
Fig. 7. Illustration summarizing the key findings of this work and the possible NAA60-related disease mechanism.
NAA60 is established here as a PFBC-linked gene by loss of its N-terminal acetyltransferase activity in cases homozygous for NAA60 variants. A possible molecular mechanistic path through which loss of NAA60 function may cause primary familial brain calcifications (PFBCs) is shown. Loss of NAA60 function entails a lack of N-terminal acetylation (Ac-N) of several membrane proteins at the Golgi apparatus, possibly including some with critical function in brain phosphate homeostasis, such as SLC20A2. The impaired targeting or function of these non-Nt-acetylated NAA60 substrates may lead to the build-up of phosphate and calcium phosphate in the brains of patients with loss-of-function variants in NAA60, possibly via a pathway involving the phosphate importer SLC20A2. Parts of the figure were drawn by using elements modified with text, markings, and annotations from Servier Medical Art, provided by Servier, licensed under a Creative Commons Attribution 3.0 (https://creativecommons.org/licenses/by/3.0/).

References

    1. Batla A, et al. Deconstructing Fahr’s disease/syndrome of brain calcification in the era of new genes. Parkinsonism Relat. Disord. 2017;37:1–10. doi: 10.1016/j.parkreldis.2016.12.024. - DOI - PubMed
    1. Balck A, et al. Genotype-phenotype relations in primary familial brain calcification: systematic MDSGene review. Mov. Disord. 2021;36:2468–2480. doi: 10.1002/mds.28753. - DOI - PubMed
    1. Nicolas G, Charbonnier C, Campion D, Veltman JA. Estimation of minimal disease prevalence from population genomic data: Application to primary familial brain calcification. Am. J. Med. Genet. B Neuropsychiatr. Genet. 2018;177:68–74. doi: 10.1002/ajmg.b.32605. - DOI - PubMed
    1. Wang C, et al. Mutations in SLC20A2 link familial idiopathic basal ganglia calcification with phosphate homeostasis. Nat. Genet. 2012;44:254–256. doi: 10.1038/ng.1077. - DOI - PubMed
    1. Legati A, et al. Mutations in XPR1 cause primary familial brain calcification associated with altered phosphate export. Nat. Genet. 2015;47:579–581. doi: 10.1038/ng.3289. - DOI - PMC - PubMed

Substances