. 2024 Mar 13;15(1):2254.
doi: 10.1038/s41467-024-46490-7.

Distinct evolution of SARS-CoV-2 Omicron XBB and BA.2.86/JN.1 lineages combining increased fitness and antibody evasion

Affiliations

Distinct evolution of SARS-CoV-2 Omicron XBB and BA.2.86/JN.1 lineages combining increased fitness and antibody evasion

Delphine Planas et al. Nat Commun. .

Abstract

The unceasing circulation of SARS-CoV-2 leads to the continuous emergence of novel viral sublineages. Here, we isolate and characterize XBB.1, XBB.1.5, XBB.1.9.1, XBB.1.16.1, EG.5.1.1, EG.5.1.3, XBF, BA.2.86.1 and JN.1 variants, representing >80% of circulating variants in January 2024. The XBB subvariants carry few but recurrent mutations in the spike, whereas BA.2.86.1 and JN.1 harbor >30 additional changes. These variants replicate in IGROV-1 but no longer in Vero E6 and are not markedly fusogenic. They potently infect nasal epithelial cells, with EG.5.1.3 exhibiting the highest fitness. Antivirals remain active. Neutralizing antibody (NAb) responses from vaccinees and BA.1/BA.2-infected individuals are markedly lower compared to BA.1, without major differences between variants. An XBB breakthrough infection enhances NAb responses against both XBB and BA.2.86 variants. JN.1 displays lower affinity to ACE2 and higher immune evasion properties compared to BA.2.86.1. Thus, while distinct, the evolutionary trajectory of these variants combines increased fitness and antibody evasion.


Conflict of interest statement

The authors declare no competing interests.

Figures

Fig. 1
Fig. 1. SARS-CoV2 evolution in 2023 and Spike mutation patterns of the main lineages.
a Evolution of the prevalence of main SARS-CoV-2 lineages from January to December 31, 2023. The pattern of emergence and replacement of several lineages, such as XBB.1.5, then XBB.1.9, XBB.1.16 or EG.5.1 and the emergence of BA.2.86 and JN.1 is shown. The variants with a frame are analyzed in this study. b Changes specific to lineages studied here in comparison to BA.2 are displayed as colored squares. The spike domain organization is displayed on the top, with N-terminal domain (NTD), Receptor Binding Domain (RBD), Receptor Binding Motif (RBM), Single domains SD1 and SD2, S1/S2 cleavage site, and S2 domains. BA.2.86 and its descendant JN.1 show many new mutations compared to other lineages. A complete comparison of spike mutations compared to the reference Wuhan_Hu-1 is presented in Fig. S1b.
Fig. 2
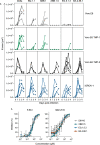
Fig. 2. Replication kinetics of SARS-CoV-2 variants in Vero E6, Vero E6 TMP-1 and -2 and IGROV-1 cells.
a Cells were infected with the indicated variants, at 3 × 10–2 infectious units per cell. Cells were stained with a pan-coronavirus anti-N antibody at days 1–4 pi. The N-positive areas were plotted on the graph. Each curve represents an independent experiment. b Comparison of the effect of E-64d and SB412515 against different variants. IGROV-1 cells were pre-incubated 2 h with serial dilutions of E-64d or SB412515 (30–1.7 × 10–4 µM) and infected with D614G, XBB.1.5, EG.5.1.3, or BA.2.86.1. The percentage of inhibition is represented. Data are mean ± s.d. of 3 independent experiments. Source data are provided as a Source Data file.
Fig. 3
Fig. 3. Fusogenicity and binding to ACE2 of the variant spike proteins.
a Schematic representation of the coculture system. 293 T GFP-11 donor cells were transfected with the indicated variant spike expression plasmids and cocultivated with IGROV-1, Vero E6 or Vero E6 TMP-1 acceptor cells expressing GFP1-10. The area of GFP+ fused cells was measured after 18 h. Image generated on Biorender. b Representative images of cell-cell fusion between 293 T donor cells and IGROV-1 acceptor cells. Scale bar, 200 μm. c Fusogenicity of the different spikes with IGROV-1 acceptor cells. Each dot represents a single experiment. Data are mean ± s.d. of 4 (XBB.1.16.1, EG.5.1.1, BA.2.86.1) or 6 independent experiments. One-way ANOVA with Kruskal-Wallis test followed by Dunn’s test for multiple comparisons to compare Delta with respective variants were conducted. Delta vs. Empty, p-value < 0.0001; Delta vs. BA.1, p-value = 0.0005; Delta vs. BA.4/5 p-value = 0.0266; Delta vs. XBB.1.16.1, p-value = 0.0107; Delta vs. EG.5.1.1, p-value = 0.0164; Delta vs. BA.2.86.1, p-value = 0.0164. d Effect of TMPRSS2 on the fusion of the different spikes. Cell-cell fusion assays were performed with Vero E6 or Vero E6 TMP-1 as target cells. Data are mean ± s.d. of 4 independent experiments. Paired t-test to compare fusion in Vero E6 versus Vero E6 TMP-1 were conducted. D614G, p-value = 0.0155; BA.1, p-value = 0.0260; BA.4/5, p-value = 0.0136; BQ.1.1, p-value = 0.0071; XBB.1.5/1.9.1, p-value = 0.001; XBB.1.16.1, p-value = 0.0172; EG.5.1.1, p-value = 0.0208; BA.2.86.1, p-value = 0.0111. e,f. Binding of soluble ACE2 to IGROV-1 infected cells (e) or to 293 T cells transiently expressing the Spike (f). Cells were stained with serial dilutions of soluble ACE2. The EC50 of ACE2 binding (µg/ml) for the indicated spike proteins is shown. Data are mean ± s.d. of 3 (f) or 4 (e) independent experiments. One-way ANOVA with Kruskal-Wallis test followed by Dunn’s test for multiple comparisons to compare Delta (e) or D614G (f) with respective variants were conducted. e Delta vs. BA.2.86.1, p-value = 0.0292. f D614G vs. BA.4/5, p-value = 0.0438; D614G vs. BA.2.86.1, p-value = 0.0017. Source data are provided as a Source Data file.
Fig. 4
Fig. 4. Replication of SARS-CoV-2 variants in hNECs.
Primary human nasal epithelial cells (hNECs) cultivated at the air–liquid interface (ALI) were exposed to the indicated SARS-CoV-2 variants. a Viral RNA release from the apical side of hNECs was measured by RT-qPCR every day up to 4 days p.i. Replication kinetics of each variant from one representative experiment are represented. b Comparison of viral RNA release at day 1 pi with the indicated variants. c Infectious viral titers in supernatants from the apical side were quantified with S-Fuse cells at day 2 p.i. b,c. Data are mean ± s.d. of 4 (D614G, Delta), 5 (BA.1, BQ1.1, XBB.1, EG.5.1.3, BA.2.86.1) or 6 (BA.5, XBB.1.5) independent experiments. One-way ANOVA with Kruskal-Wallis test followed by Dunn’s test for multiple comparisons to compare Delta with respective variants were conducted. c D614G vs. BQ.1.1, p-value = 0.0032; D614G vs. XBB.1, p-value = 0.0116; D614G vs. EG.5.1.3, p-value = 0.0057. d Immunofluorescence of hNECs stained for tubulin (cyan), actin (yellow), SARS-CoV-2 Nucleocapsid (green) and cleaved caspase-3 (red). Shown is one representative field (150 × 150 mm) of each variant. Images are from one representative experiment out of 2. Scale bar = 20 μm. Source data are provided as a Source Data file.
Fig. 5
Fig. 5. Activity of neutralizing mAbs and antiviral drugs against SARS-CoV-2 variants.
a Neutralization curves of previously approved mAbs. Dose–response analysis of neutralization of the indicated variants by Sotrovimab, Evusheld (Cilgavimab and Tixagevima) and Ronapreve (Casirivimab and Imdevimab). b Inhibitory curves of antiviral drugs against the indicated variants. Dose-response analysis of the antiviral effect of Nirmatrelvir, Remdesivir and Molnupiravir. a, b Data are mean ± s.d. of 3 independent experiments. Source data are provided as a Source Data file.
Fig. 6
Fig. 6. Sensitivity of SARS-CoV-2 variants to sera of vaccinated and/or infected individuals.
Neutralization titers of the sera against the indicated viral variants are expressed as ED50. a Neutralizing activity of sera from individuals vaccinated with 3 doses of Pfizer vaccine. Sera (n = 21) were sampled 25–475 days after the third dose. 13/21 had a breakthrough infection at the time of BA.1/2 circulation. b, c. Neutralizing activity of sera from individuals having received the bivalent Wuhan/BA.5 Pfizer boost. Sera were sampled 1 month (b; n = 20) and 6 months (c; n = 14) after the booster dose. d Temporal evolution of Neutralizing Antibody (Nab) titers against D614G, BA.5, EG.5.1.3 and BA.2.86.1 after bivalent Wuhan/BA.5 booster dose. The Nab titers were calculated at the time of injection (month 0) and at the indicated months after injection. e Neutralizing activity of sera from Pfizer-vaccinated recipients after XBB-derived breakthrough infections (infections occurred in September 2023, when XBB-derived variants were predominantly circulating in France). Sera were sampled 10–50 days after the breakthrough (n = 12). The dotted line indicates the limit of detection (ED50 = 30). Each dot represents the mean of n = 2 independent experiments. Black lines represent the median values. Two-sided Friedman test with Dunn’s test for multiple comparisons was performed to compare each viral strain to D614G. 3 doses of Pfizer vaccin: D614G vs. BQ.1.1, p-value = 0.0008; D614G vs. XBB.1, p-value < 0.0001; D614G vs. XBB.1.5, p-value < 0.0001; D614G vs. XBB.1.9.1, p-value < 0.0001; D614G vs. XBB.1.16.1, p-value < 0.0001; D614G vs. XBF, p-value < 0.0001; D614G vs. EG.5.1.3, p-value < 0.0001; D614G vs. BA.2.86.1, p-value < 0.0001. One month after booster dose: D614G vs. BQ.1.1. p-value = 0.0165; D614G vs. XBB.1. p-value < 0.0001; D614G vs. XBB.1.5. p-value = 0.0003; D614G vs. XBB.1.9.1. p-value < 0.0001; D614G vs. XBB.1.16.1. p-value < 0.0001; D614G vs. XBF. p-value < 0.0001; D614G vs. EG.5.1.3. p-value < 0.0001; D614G vs. BA.2.86.1. p-value < 0.0001. Six months after booster dose: D614G vs. BQ.1.1. p-value = 0.0420; D614G vs. XBB.1. p-value < 0.0001; D614G vs. XBB.1.5. p-value < 0.0001; D614G vs. XBB.1.9.1. p-value < 0.0001; D614G vs. XBB.1.16.1. p-value < 0.0001; D614G vs. XBF. p-value = 0.0018; D614G vs. EG.5.1.3. p-value < 0.0001; D614G vs. BA.2.86.1. p-value < 0.0001. After XBB-derived breakthrough infections: D614G vs. XBB.1. p-value = 0.0017; D614G vs. XBB.1.9.1. p-value < 0.0001; D614G vs. XBB.1.16.1. p-value < 0.0001; D614G vs. EG.5.1.3. p-value = 0.0002; D614G vs. BA.2.86.1. p-value = 0.0014. Source data are provided as a Source Data file.
Fig. 7
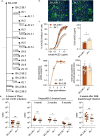
Fig. 7. Comparative analysis of BA.2.86.1 and JN.1 variants.
a Schematic tree describing BA.2.86 expanding diversity. Only substitutions in the spike are noted on branches. b Representative images of cell-cell fusion in S-Fuse cells after infection with BA.2.86.1 and JN.1. Scale bar, 200 μm. c Binding of soluble ACE2 to IGROV-1 infected cells. Data are mean ± s.d (bands) of 2 independent experiments. Infected cells were stained with serial dilutions of soluble hACE2 (left panel). The EC50 of ACE2 (in µg/ml) is displayed (right panel). Data are mean ± s.d. of two independent experiments in duplicate. A Two-side Mann-Whitney test was performed. d Viral RNA release from the apical side of hNECs was measured by RT-qPCR every day up to 4 days p.i. Replication kinetics of BA.86.1 and JN.1 variants from one representative experiment out of 2 are represented (left). Comparison of viral RNA release at day 1 pi with BA.2.86.1 (n = 15) and JN.1 (n = 12) (right). Data are mean ± s.d. of samples from 4 independent experiments for BA2.86.1 and 2 independent experiments for JN.1. e Comparison of neutralization titers against BA.2.86.1 and JN.1 in sera from individuals in the Orléans cohort. Neutralizing activity of sera (n = 13) from individuals vaccinated with 3 doses of Pfizer original vaccine, sampled 25–475 days after the third dose (left panel). 9/13 had a breakthrough infection at the time of BA.1/2 circulation. Neutralization activity of sera from recipients of a bivalent Wuhan/BA.5 booster dose. Sera were sampled at 1 (n = 12), 3 (n = 7) and 6 (n = 8) months after the booster dose (middle panel). Neutralization activity of sera from Pfizer-vaccinated individuals with a breakthrough infection in September 2023, when XBB-derived variants were predominantly circulating in France (n = 12) (right panel). Sera were sampled 10–50 days post-breakthrough infection. The dotted line indicates the limit of detection (ED50 = 30). Each dot represents the mean of n = 2 independent experiments. Black lines represent the median values. c,d,e: A Two-side Mann-Whitney test was performed. c BA.2.86.1 vs. JN.1, p-value = 0.0286; e. 3 doses of Pfizer: BA.2.86.1 vs. JN.1, p-value = 0.0010; 1 month after booster dose: BA.2.86.1 vs. JN.1, p-value = 0.0005; 3 month after booster dose: BA.2.86.1 vs. JN.1, p-value = 0.0156; 6 onth after booster dose: BA.2.86.1 vs. JN.1, p-value = 0.0156; After XBB-derived breakthrough infections: BA.2.86.1 vs. JN.1, p-value = 0.0005. Source data are provided as a Source Data file.

Update of

Similar articles

Cited by

References

    1. Viana R, et al. Rapid epidemic expansion of the SARS-CoV-2 Omicron variant in southern Africa. Nature. 2022;603:679–686. doi: 10.1038/s41586-022-04411-y. - DOI - PMC - PubMed
    1. Tegally H, et al. Emergence of SARS-CoV-2 Omicron lineages BA.4 and BA.5 in South Africa. Nat. Med. 2022;28:1785–1790. doi: 10.1038/s41591-022-01911-2. - DOI - PMC - PubMed
    1. Andrews N, et al. Covid-19 vaccine effectiveness against the Omicron (B.1.1.529) variant. New Eng. J. Med. 2022;386:1532–1546. doi: 10.1056/NEJMoa2119451. - DOI - PMC - PubMed
    1. Abu-Raddad LJ, et al. Effect of mRNA vaccine boosters against SARS-CoV-2 Omicron infection in Qatar. New Eng. J. Med. 2022;386:1804–1816. doi: 10.1056/NEJMoa2200797. - DOI - PMC - PubMed
    1. Kuhlmann C, et al. Breakthrough infections with SARS-CoV-2 omicron despite mRNA vaccine booster dose. The Lancet. 2022;399:625–626. doi: 10.1016/S0140-6736(22)00090-3. - DOI - PMC - PubMed

Substances