. 2024 Mar 13;15(1):2258.
doi: 10.1038/s41467-024-45889-6.

Charting cellular differentiation trajectories with Ricci flow

Affiliations

Charting cellular differentiation trajectories with Ricci flow

Anthony Baptista et al. Nat Commun. .

Abstract

Complex biological processes, such as cellular differentiation, require intricate rewiring of intra-cellular signalling networks. Previous characterisations revealed a raised network entropy underlies less differentiated and malignant cell states. A connection between entropy and Ricci curvature led to applications of discrete curvatures to biological networks. However, predicting dynamic biological network rewiring remains an open problem. Here we apply Ricci curvature and Ricci flow to biological network rewiring. By investigating the relationship between network entropy and Forman-Ricci curvature, theoretically and empirically on single-cell RNA-sequencing data, we demonstrate that the two measures do not always positively correlate, as previously suggested, and provide complementary rather than interchangeable information. We next employ Ricci flow to derive network rewiring trajectories from stem cells to differentiated cells, accurately predicting true intermediate time points in gene expression time courses. In summary, we present a differential geometry toolkit for understanding dynamic network rewiring during cellular differentiation and cancer.


Conflict of interest statement

The authors declare no competing interests.

Figures

Fig. 1
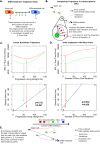
Fig. 1. Overview of Ricci curvature and flow approach for biological networks.
A Schematic of the transcriptomic phase space interpretation of the Waddington Landscape. Permissive trajectories are interpreted as geodesics which can be considered within Euclidean geometry via consideration of Ricci curvature. Protein interaction networks can be used to approximate height in the landscape by network entropy and possibly by discrete Ricci curvature. B Schematic describing mass action principle weighting of protein interaction network with transcriptomic data, alongside required parameter choices and corresponding constraints to implement Ricci flow. C An interpretation of edge curvature in terms of node proximity in an underlying metric space and consequences for parameter choices.
Fig. 2
Fig. 2. Examining the association between network entropy and total Forman-Ricci curvature in a toy network.
A A simple k-star network with k + 1 nodes, k nodes of degree 1 are connected to a central node of degree k. Node weights are set to 1 for all nodes except j, which is set to some ϵ > 0. B Plot of network entropy against ϵ for k = 2, …, 20, colours from blue to brown denote increasing k. C Plot of total Forman-Ricci curvature against ϵ for k = 2, …, 20, colours from blue to brown denote increasing k. D Plot of total Forman-Ricci curvature against network entropy for k = 2, …, 20, colours from blue to brown denote increasing k. E Probability bar charts comparing the “one for many" to “many for one" regimes.
Fig. 3
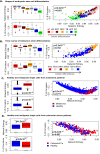
Fig. 3. Forman-Ricci curvature and network entropy follow two distinct regimes in biological data.
Boxplots and scatter plots display network entropy and Forman-Ricci curvature for A. 1018 single cells during distinct stages of embryonic stem cell (ESC) differentiation (colours label samples at different stages of differentiation: red=H1, pink=H9, dark red=NPC, orange=DEC, light blue=TB, dark blue=HFF, green=EC), B 758 single cells sampled at 6 distinct time points of ESC differentiation (colours label samples taken at different times during differentiation: red=0 h, pink = 12 h, dark red = 24 h, orange = 36 h, light blue = 72 h, dark blue = 96 h), C 1257 malignant and 3256 control cells from 19 patients with malignant melanoma (colours label phenotype: red=malignant, blue=healthy) and D 272 malignant and 160 healthy cells from patients with colorectal carcinoma (colours label phenotype: red=colorectal cancer, blue=healthy). Boxplots present data as follows: minima: minimum value, maxima: maximum value, centre: median, bounds of box: first and third quartile, whiskers: lowest value within 1.5 × interquartile range of the first quartile, to largest value within 1.5 × interquartile range of the third quartile. Two-sided Wilcoxon p-values are displayed on boxplots, and Pearson’s r and corresponding two-sided p-values are displayed on scatter plots. In stem cells network entropy and total Forman-Ricci curvature positively correlate, while for more committed cells there is a negative correlation. Source data are provided as a Source Data file.
Fig. 4
Fig. 4. Ricci flow correctly orders differentiation time course during embryonic stem cell (ESC) differentiation.
A Schematic shows samples taken during ESC differentiation. B Schematic demonstrates how transcriptomic trajectories are compared to true biological data points. C Ordering of data points along a straight Euclidean trajectory, two-sided p-value and Pearson’s r describe the association between closest pass iteration of the trajectory to true data points and differentiation time of the true data points. D Ordering of data points along Ricci flow trajectory, two-sided p-value and Pearson’s r describe the association between closest pass iteration of the trajectory to true data points and differentiation time of the true data points. The final time point, by construction occurs at iteration 150 at the end of the trajectory. Points and lines are coloured according to differentiation time of the sample being assessed for closest pass: dark red = 0 h, red = 12 h, pink = 24 h, green = 36 h, light blue = 72 h, dark blue = 96 h. E Schematic compares Euclidean straight line to the Ricci flow trajectory. Source data are provided as a Source Data file.
Fig. 5
Fig. 5. Ricci flow correctly orders differentiation time course during myoblast differentiation.
A Schematic shows samples taken during myoblast differentiation in triplicate. B Ordering of data points along Euclidean straight line, two-sided p-value and Pearson’s r describe the association between closest pass iteration of the trajectory to true data points and differentiation time of the true data points. C Ordering of data points along Ricci flow trajectory, two-sided p-value and Pearson’s r describe the association between the closest pass iteration of the trajectory to true data points and differentiation time of the true data points. The final time point, by construction, occurs at iteration 150 at the end of the trajectory. Points are coloured according to differentiation time of the sample being assessed for closest pass: dark red = 0 min, red = 440 min, pink = 530 min, orange = 1355 min, green = 1505 min, light blue = 1860 min, dark blue = 2165 min, purple = 5040 min. Source data are provided as a Source Data file.

Similar articles

Cited by

References

    1. Hanahan D. Hallmarks of cancer: new dimensions. Cancer Discov. 2022;12:31–46. doi: 10.1158/2159-8290.CD-21-1059. - DOI - PubMed
    1. Waddington, C. H. An Introduction to Modern Genetics. (George Alien & Unwin, London,1939)
    1. MacArthur BD, Maayan A, Lemischka IR. Systems biology of stem cell fate and cellular reprogramming. Nat. Rev. Mol. Cell biol. 2009;10:672–681. doi: 10.1038/nrm2766. - DOI - PMC - PubMed
    1. MacArthur BD, Ma’ayan A, Lemischka IR. Toward stem cell systems biology: from molecules to networks and landscapes. Cold Spring Harb.Symposia Quant. Biol. 2008;73:211–215. doi: 10.1101/sqb.2008.73.061. - DOI - PMC - PubMed
    1. Wang J, Zhang K, Xu L, Wang E. Quantifying the Waddington landscape and biological paths for development and differentiation. Proc. Natl Acad. Sci. USA. 2011;108:8257–8262. doi: 10.1073/pnas.1017017108. - DOI - PMC - PubMed