. 2024 Mar 13;15(1):2262.
doi: 10.1038/s41467-024-46579-z.

Natural variation in OsMYB8 confers diurnal floret opening time divergence between indica and japonica subspecies

Affiliations

Natural variation in OsMYB8 confers diurnal floret opening time divergence between indica and japonica subspecies

Yajun Gou et al. Nat Commun. .

Abstract

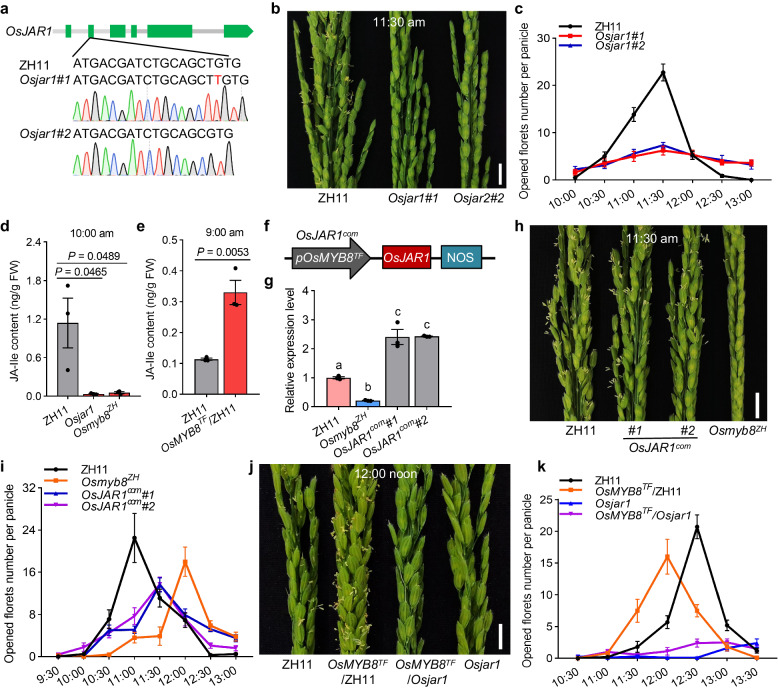
The inter-subspecific indica-japonica hybrid rice confer potential higher yield than the widely used indica-indica intra-subspecific hybrid rice. Nevertheless, the utilization of this strong heterosis is currently hindered by asynchronous diurnal floret opening time (DFOT) of indica and japonica parental lines. Here, we identify OsMYB8 as a key regulator of rice DFOT. OsMYB8 induces the transcription of JA-Ile synthetase OsJAR1, thereby regulating the expression of genes related to cell osmolality and cell wall remodeling in lodicules to promote floret opening. Natural variations of OsMYB8 promoter contribute to its differential expression, thus differential transcription of OsJAR1 and accumulation of JA-Ile in lodicules of indica and japonica subspecies. Furthermore, introgression of the indica haplotype of OsMYB8 into japonica effectively promotes DFOT in japonica. Our findings reveal an OsMYB8-OsJAR1 module that regulates differential DFOT in indica and japonica, and provide a strategy for breeding early DFOT japonica to facilitate breeding of indica-japonica hybrids.


Conflict of interest statement

The authors declare no competing interests.

Figures

Fig. 1
Fig. 1. DFOT divergence in rice subspecies.
a Diurnal floret opening time (DFOT) of japonica cultivars (n = 12 accessions) and indica cultivars (n = 28 accessions) in October 2019 in Guangzhou. b, c Comparison of panicles undergoing floret opening in the indica cultivar TFB and japonica cultivar ZH11 at 10:30 am (b) and 12:00 noon in October 2020 in Guangzhou (c). Scale bars, 1 cm. d, e The DFOT of TFB and ZH11 in June 2020 in Guangzhou (d) and October 2020 in Guangzhou (e). f Lodicule morphology of TFB and ZH11 at different time points in October 2020 in Guangzhou. Scale bars, 250 μm. The boxed areas indicate the corresponding florets. (n = 10 lodicules). g Viewing the lodicule as an ellipsoid, its x, y, and z-axes are shown in the diagram. h Quantitative comparison of lodicules volume in ZH11 and TFB at different time points. Lodicule volume was calculated using the ellipsoid volume formula (V = 4πabc/3). a, b, and c correspond to the semi-axes along the x, y, and z-axes shown in g. Values are means ± SEM. (n = 10 lodicules). i Analysis of the water content of 100 pairs lodicules of ZH11 and TFB at different time points. Values are means ± SEM. (n = 3 biological replicates). Source data are provided as a Source Data file.
Fig. 2
Fig. 2. Identification of OsMYB8 by comparative transcriptomic analysis of lodicules between indica and japonica.
a Principal component analysis (PCA) of the transcriptome datasets of lodicules between TFB and ZH11 at different time points. T18 and Z18 indicate 18:00 the day before floret opening; T9 and Z9 indicate 9:00 am (1 h and 3 h before floret opening in TFB and ZH11, respectively); Z11 indicate 11:00 am (1 h before opening in ZH11); TF and ZF indicate the time undergoing peak floret opening time (~10:00 am in TFB; ~12:00 noon in ZH11). b Venn Diagram showing the number of overlapping genes between the Cluster18 genes and up-regulated DEGs from T9 vs Z9. c Gene Ontology (GO) enrichment analysis of 251 overlap genes in (b). MF indicates molecular function, BP indicates biological process. The term of “transcription factor activity” is highlighted in red. d Expression analysis of 11 transcription factors selected through GO analysis in (c). The numbers in the heatmap represent the average FPKM values. e Reverse transcriptional quantitative PCR (RT-qPCR) analysis of OsMYB8 expression level in the lodicules of TFB and ZH11 at 9:00 am in June and October in 2021. Values are mean ± SEM. (n = 3 biological replicates). Significance is evaluated by the two-sided Student’s t-test at each time point, and P values are indicated. Source data are provided as a Source Data file.
Fig. 3
Fig. 3. OsMYB8 positively regulates rice DFOT.
a Creation of the Osmyb8 mutants using the CRISPR/Cas9 genome editing approach. Osmyb8 mutants in ZH11 and TFB backgrounds were named as Osmyb8ZH and Osmyb8TF respectively. The upper panel shows a schematic diagram of the OsMYB8 gene bearing the CRISPR/Cas9 target site. The mutation site was indicated in red. b, e, j Comparison of panicles in ZH11 and Osmyb8ZH mutants at 11:30 am (b) TFB and Osmyb8TF mutants at 10:00 am (e) ZH11 and OsMYB8TF/ZH11 lines at 10:00 am in June 2021 in Guangzhou (j). Scale bars, 1 cm. c, f, k Number of opened florets per panicle in ZH11 and Osmyb8ZH mutants (c), TFB and Osmyb8TF mutants (f), and ZH11 and OsMYB8TF/ZH11 lines (k) at different time points of the day in June 2021 in Guangzhou. Values are means ± SEM. (n = 8 panicles). d, g, l Number of opened florets in ZH11 and Osmyb8ZH mutants (d), TFB and Osmyb8TF mutants (g), and ZH11 and OsMYB8TF/ZH11 lines (l) at different days after heading in June 2021 in Guangzhou. Values are means ± SEM. (n = 10 panicles). h Schematic diagram of the vector structure used for constructing OsMYB8TF/ZH11 transgenic plants. i RT-qPCR analysis of OsMYB8 transcripts levels in the lodicules of the OsMYB8TF/ZH11 transgenic lines. ZH11 was used as a negative control. Values are means ± SEM. (n = 3 biological replicates). Significance is evaluated by the two-sided Student’s t-test, and P values are indicated. Source data are provided as a Source Data file.
Fig. 4
Fig. 4. Identification of the genome-wide direct targets of OsMYB8.
a Nuclear localization of OsMYB8-GFP in rice protoplasts. D53-mCherry was used as a nuclear marker. Scale bars, 20 μm. b Yeast two-hybrid assay showing the transcriptional activity of OsMYB8. Left is the diagrams of full-length and truncated OsMYB8 proteins, which were fused with the DNA-binding domain (BD). c The core binding motif of OsMYB8 protein identified using MEME-ChIP. d Venn diagrams showing a comparison of DAP-seq binding genes with the identified DEGs in Osmyb8 mutants by RNA-seq. e GO enrichment analysis of 345 overlap genes in (d). MF indicates molecular function, BP indicates biological process. f ChIP-qPCR analysis showing that OsMYB8 binds to the OsJAR1 promoter in vivo. The upper panel is a diagram of OsJAR1 promoter with the indicated regions used for detection by ChIP-qPCR. The red lines indicate the position of “TTHGGY” motifs in the OsJAR1 promoter regions. Immunoprecipitation was performed with anti-GFP antibody, ZH11 was used as a negative control. (n = 3 technical replicates). g EMSA assay showing that GST-OsMYB8 recombinant protein directly binds to the “TTHGGY” motif-containing regions of the OsJAR1 promoter. Unlabeled probes were used as competitors. GST was used as a negative control. h Transient dual-LUC assay showing that OsMYB8 induces the transcriptions of OsJAR1 promoter in rice protoplasts. The upper panel is diagrams of various constructs used in the transient expression assay. The expression level of REN was used as an internal control. The LUC/REN ratio represents the relative activity of the OsJAR1 promoter. (n = 3 technical replicates). The Values in (f) and (h) are means ± SEM. Significance is evaluated by the two-sided Student’s t-test, and P values are indicated. The subcellular localization experiments in (a) and the EMSA experiments in (g) were independently repeated three times with similar results. Source data are provided as a Source Data file.
Fig. 5
Fig. 5. OsJAR1 influences JA-Ile content in lodicule to regulate rice DFOT.
a Creation of the Osjar1 mutants in ZH11 background using the CRISPR/Cas9 genome editing approach. The mutation site was indicated in red. b Comparison of panicles in ZH11 and Osjar1 mutants at 11:30 am in June 2022 in Guangzhou. Scale bars, 1 cm. c Number of opened florets per panicle in ZH11 and Osjar1 mutants at different time points of the day. Values are mean ± SEM. (n = 10 panicles). d, e JA-Ile content in lodicules at 10:00 am of ZH11, Osjar1, and Osmyb8ZH (d) at 9:00 am of ZH11 and OsMYB8TF/ZH11(e). Values are mean ± SEM. (n =  3 biological replicates). Significance is evaluated by the two-sided Student’s t-test, and P values are indicated. f Schematic diagram of the vector structure used for constructing OsJAR1com materials. The pOsMYB8TF means the promoter was amplified from TFB. g Relative expression level of OsJAR1 in the lodicules of ZH11, OsJAR1com and Osmyb8ZH. Values are means ± SEM. (n = 3 biological replicates). Letters above the bars indicate significant differences (P < 0.05), as evaluated by one-way ANOVA with Tukey’s multiple comparisons test. h, j Comparison of panicles in ZH11, OsJAR1com and Osmyb8ZH at 11:30 am in June 2022 in Guangzhou (h) and in ZH11, OsMYB8TF/ZH11, OsMYB8TF/Osjar1 and Osjar1 at 12:00 noon in October 2022 in Guangzhou (j). Scale bars, 1 cm. i Number of opened florets in ZH11, OsJAR1com, and Osmyb8ZH at different time points of the day in June 2022 in Guangzhou. Values are mean ± SEM. (n = 10 panicles). k Number of opened florets in ZH11, OsMYB8TF/ZH11, OsMYB8TF/Osjar1, and Osjar1 at different time points of the day in October 2022 in Guangzhou. Values are mean ± SEM. (n = 10 panicles). Source data are provided as a Source Data file.
Fig. 6
Fig. 6. Natural variation in OsMYB8 promoter confers DFOT divergence in japonica and indica.
a Haplotype analysis of OsMYB8 promoter in the 3513 rice germplasms. Nucleotide variations in the 2-kb promoter of OsMYB8 were shown. b Distribution frequency of the three OsMYB8 haplotypes in diverse Asian cultivated rice accession. The haplotype with the largest number was highlighted in red. c Nucleotide diversity (π) of a 100-kb genomic region surrounding OsMYB8 in the indica (Ind), temperate japonica (TeJ) and O. rufipogon (Ruf). The regions (Chr1: 25,590,725–25,592,725) between two black vertical lines indicates the position of OsMYB8 promoter. d FST values of TeJ_Ind, Ruf_TeJ, and Ruf_Ind in a 100-kb genomic region surrounding OsMYB8. The region (Chr1: 25,590,725–25,592,725) between two black vertical lines indicates the position of OsMYB8 promoter. e The DFOT of the rice accessions with Hap1 and Hap2 in May 2022 in Guangzhou. (n = 30 accessions). f Relative expression levels of OsMYB8 in lodicules of the rice accessions with Hap1 and Hap2, respectively. (n = 10 accessions). g JA-Ile content in TFB and ZH11 lodicules at 9:00 am. (n = 3 biological replicates). h Transient dual-luciferase assays showing the transcriptional activity of pOsMYB8Hap1 and pOsMYB8Hap2 in rice protoplasts. (n = 3 technical replicates). The values in fh are shown as mean ± SEM. Significance is evaluated by the two-sided Student’s t-test, and P values are indicated. i Relative expression levels of OsMYB8 in lodicules of ZH11, OsMYB8TF/Osmyb8ZH transgenic lines and the Osmyb8ZH mutant. Values are mean ± SEM. (n = 3 biological replicates). Letters above the bars indicate significant differences (P < 0.05), as evaluated by one-way ANOVA with Tukey’s multiple comparisons test. j Comparison of panicles in ZH11, OsMYB8TF/Osmyb8ZH transgenic lines and the Osmyb8ZH mutant at 11:30 am in October 2022 in Guangzhou. Scale bars, 1 cm. k Number of opened florets in ZH11, OsMYB8TF/Osmyb8ZH transgenic lines, and the Osmyb8ZH mutant at different time points of the day in October 2022 in Guangzhou. Values are mean ± SEM. (n = 10 panicles). Source data are provided as a Source Data file.
Fig. 7
Fig. 7. The indica allele of OsMYB8 promotes japonica DFOT.
a, d Comparison of panicles in ZH11 and NILTFB (a) XS134 and CSSL9311 (d) at 12:00 noon in October 2022 in Guangzhou. Scale bars, 1 cm. b, e Number of opened florets in ZH11 and NILTFB (b) XS134 and CSSL9311 (e) at different time points of the day in October 2022 in Guangzhou. Values are mean ± SEM. (n = 10 panicles). c, f Relative expression levels of OsMYB8 and OsJAR1 in lodicules of ZH11 and NILTFB (c) XS134 and CSSL9311 (f). Values are mean ± SEM. (n = 3 biological replicates). Significance is evaluated by the two-sided Student’s t-test, and P values are indicated. g A model depicting an OsMYB8-OsJAR1 module regulating differential DFOT in indica and japonica rice. Natural variation in the promoter sequences of OsMYB8 confers higher expression level of OsMYB8 in indica, thus higher accumulation of JA-Ile and earlier DFOT in indica as compared to japonica. Source data are provided as a Source Data file.

References

    1. Sasaki A, et al. Green revolution: a mutant gibberellin-synthesis gene in rice. Nature. 2002;416:701–702. doi: 10.1038/416701a. - DOI - PubMed
    1. Fan Y, Zhang Q. Genetic and molecular characterization of photoperiod and thermo-sensitive male sterility in rice. Plant Reprod. 2018;31:3–14. doi: 10.1007/s00497-017-0310-5. - DOI - PubMed
    1. Wang H, Deng X. Development of the “third-generation” hybrid rice in China. Genom. Proteom. Bioinf. 2018;16:393–396. doi: 10.1016/j.gpb.2018.12.001. - DOI - PMC - PubMed
    1. Qian Q, Zhang F, Xin Y. Yuan Longping and hybrid rice research. Rice. 2021;14:101. doi: 10.1186/s12284-021-00542-4. - DOI - PMC - PubMed
    1. Ma G, Yuan L. Hybrid rice achievements, development and prospect in China. J. Integr. Agr. 2015;14:197–205. doi: 10.1016/S2095-3119(14)60922-9. - DOI