. 2024 Mar 13;15(1):2280.
doi: 10.1038/s41467-024-46685-y.

Dendritic cell-targeted therapy expands CD8 T cell responses to bona-fide neoantigens in lung tumors

Affiliations

Dendritic cell-targeted therapy expands CD8 T cell responses to bona-fide neoantigens in lung tumors

Lucía López et al. Nat Commun. .

Abstract

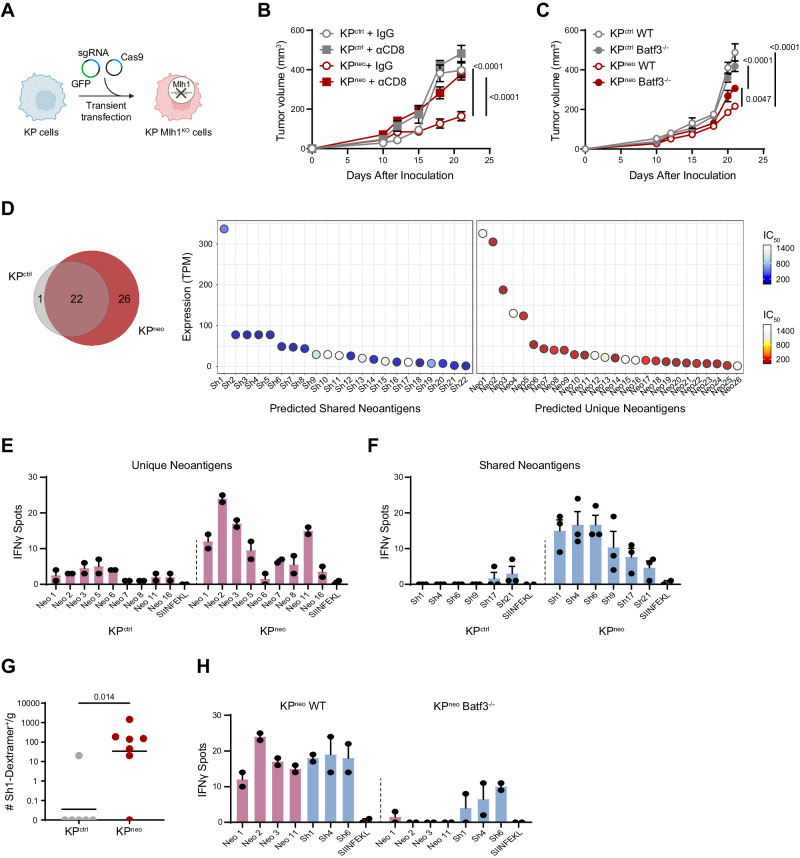
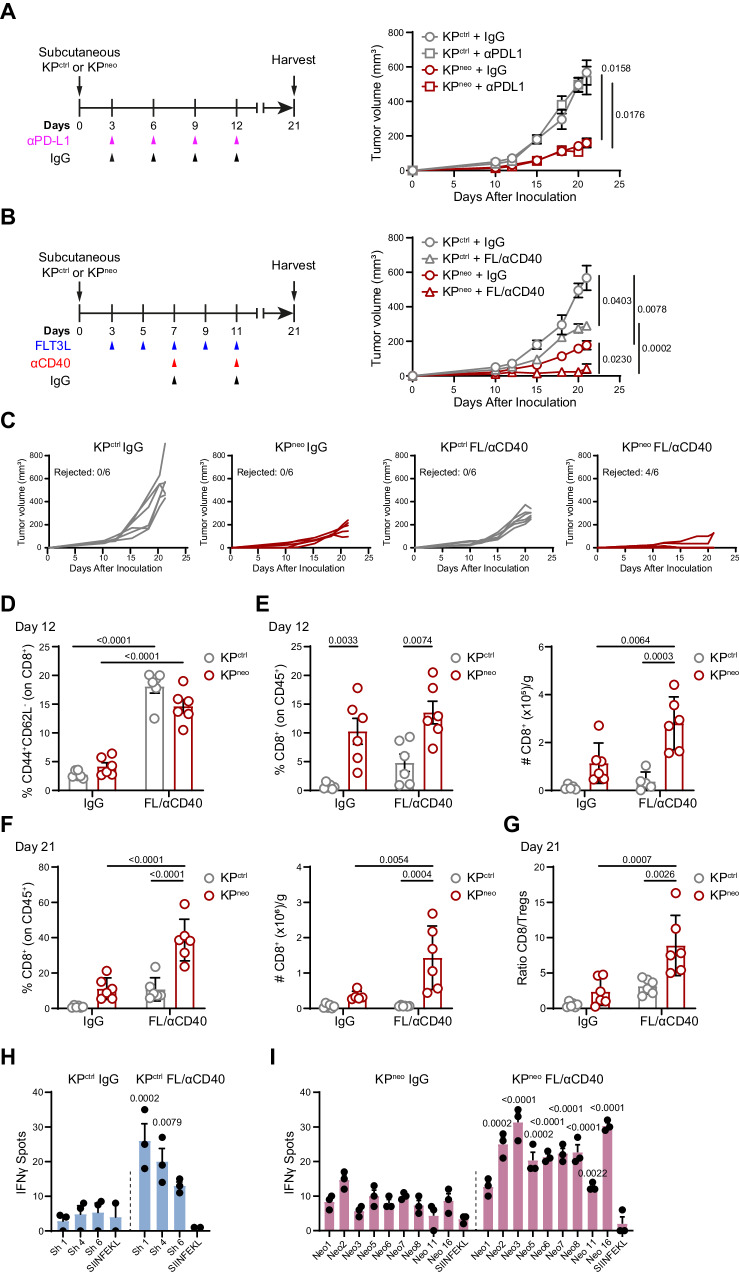
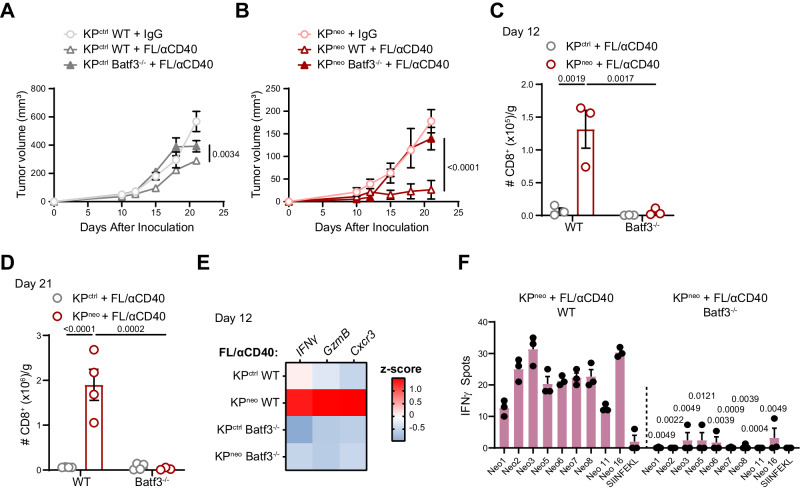
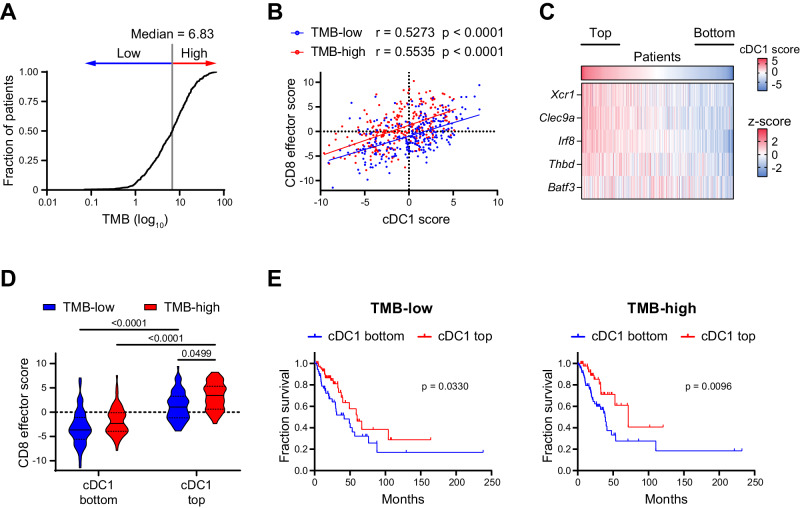
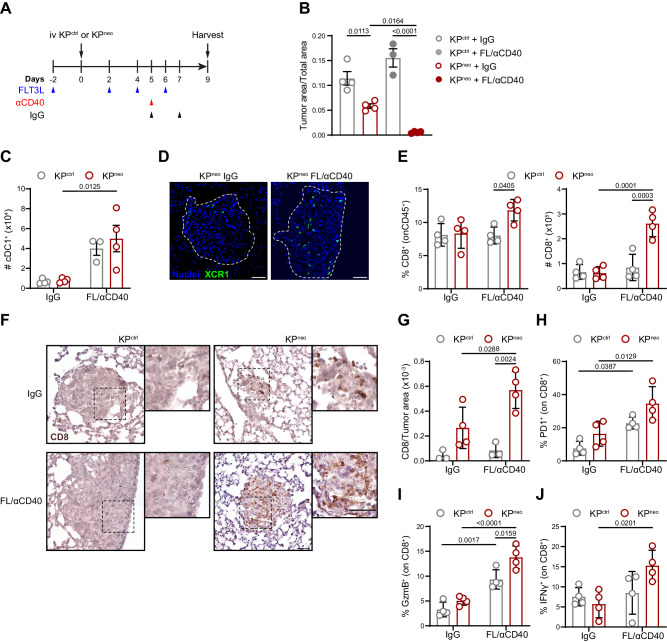
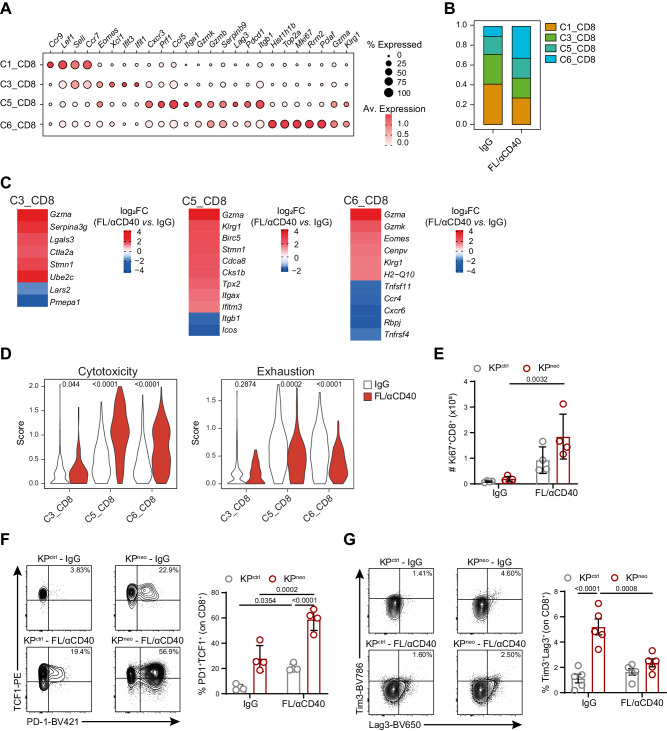
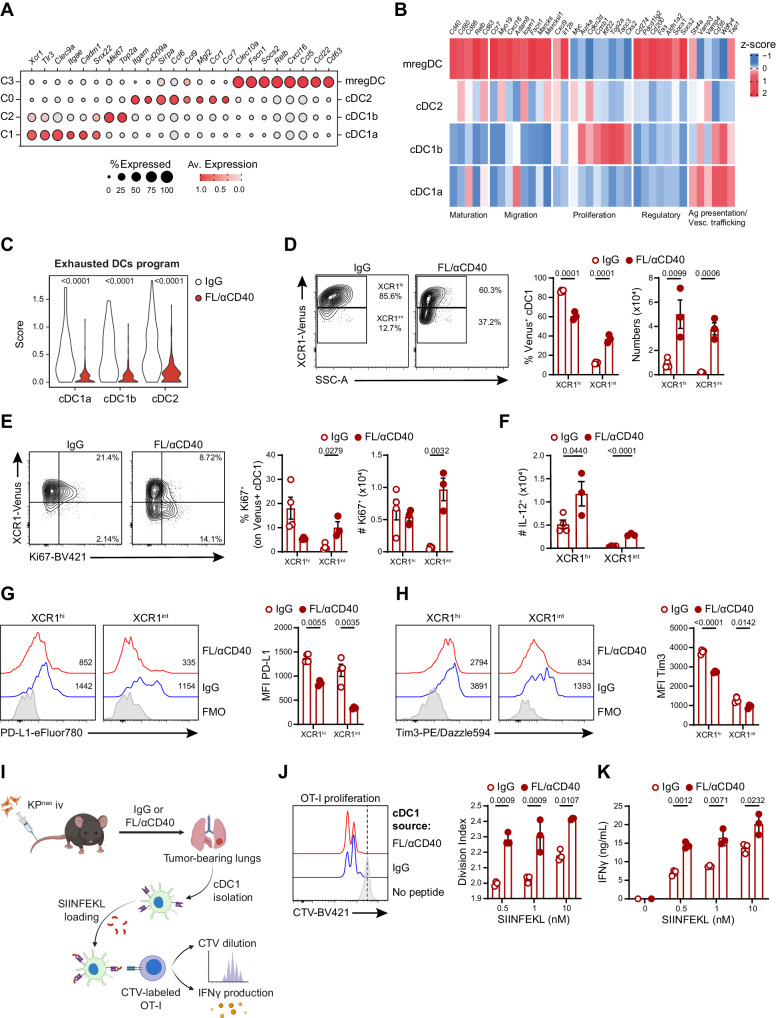
Cross-presentation by type 1 DCs (cDC1) is critical to induce and sustain antitumoral CD8 T cell responses to model antigens, in various tumor settings. However, the impact of cross-presenting cDC1 and the potential of DC-based therapies in tumors carrying varied levels of bona-fide neoantigens (neoAgs) remain unclear. Here we develop a hypermutated model of non-small cell lung cancer in female mice, encoding genuine MHC-I neoepitopes to study neoAgs-specific CD8 T cell responses in spontaneous settings and upon Flt3L + αCD40 (DC-therapy). We find that cDC1 are required to generate broad CD8 responses against a range of diverse neoAgs. DC-therapy promotes immunogenicity of weaker neoAgs and strongly inhibits the growth of high tumor-mutational burden (TMB) tumors. In contrast, low TMB tumors respond poorly to DC-therapy, generating mild CD8 T cell responses that are not sufficient to block progression. scRNA transcriptional analysis, immune profiling and functional assays unveil the changes induced by DC-therapy in lung tissues, which comprise accumulation of cDC1 with increased immunostimulatory properties and less exhausted effector CD8 T cells. We conclude that boosting cDC1 activity is critical to broaden the diversity of anti-tumoral CD8 T cell responses and to leverage neoAgs content for therapeutic advantage.


Conflict of interest statement

A.B. and G.G. are cofounders and shareholders of NeoPhore. A.B. is a member of the NeoPhore scientific advisory board. The remaining authors declare no competing interests.

Figures

Fig. 1
Fig. 1. Increasing neoAgs in KP drives cDC1-dependent anti-tumoral responses to neoAgs.
A KP cells were transiently transfected with CAS9 and sgRNA targeting the Mlh1 locus to generate Mlh1-deficient cells, or CAS9 alone (KPctrl) (Created with BioRender.com). B, C 5 × 105 KPctrl or KPneo tumor cells were implanted subcutaneously, and tumor outgrowth was measured at the indicated time points. B Mice were treated with anti-CD8 antibodies or isotype control (IgG) (n = 5, data are from one out of the two independent experiments). C Tumor cells were implanted into wild-type or Batf3−/− (n = 6, data are from one out of two independent experiments). D The Venn diagram represents the number of shared and unique neoantigens expressed at mRNA level in KPctrl and KPneo cells. neoAgs commonly expressed in KPctrl and KPneo (shared, sh) and neoAgs expressed de-novo in KPneo (unique, neo) are plotted according to expression levels (TPM) and affinity for MHC class-I (IC50). E, F At day 12 after challenge, splenic CD8 T from KPctrl or KPneo tumor-bearing mice were restimulated with selected unique (E) or shared (F) individual neoAgs and tested for IFN-g by ELISpot. Individual dots are technical replicates from one representative experiment (pooled CD8 T cells from 3 mice), out of three performed. G KPctrl or KPneo tumor tissues were harvested at day 26 and labeled with sh1 MHC class I-specific dextramers to identify neoAg-specific CD8+ T cells. Data from 1 experiment with 6 animals for KPctrl and 7 animals for KPneo group. H) Wild type or Batf3−/− mice were challenged with KPneo tumors. At day 12, CD8 T cells were isolated from the spleen to test reactivity against selected shared and unique peptides by IFN-γ ELISpot. Individual dots are technical replicates from one representative experiment (pooled CD8 T cells from 3 mice), out of three performed. Two-way ANOVA followed by Sidak’s post-test in (B), or Tukey’s post-test in C, two-tailed Mann-Whitney U test in (G). All data are plotted as mean ± SEM. Source data are provided as a Source Data File.
Fig. 2
Fig. 2. Flt3L/αCD40 therapy induces regression of KPneo tumors and has a mild impact on KPctrl tumors.
A Scheme of anti-PD-L1 (αPD-L1) or IgG treatment in KPctrl or KPneo tumors (left). Tumor outgrowth (right). B Flt3L and anti-CD40 (FL/αCD40) therapy or IgG administration scheme in KPctrl and KPneo tumors (left). Tumor outgrowth (right). C Growth of individual tumors showed in (B), indicating the fraction of rejected tumors in each group. D Frequencies of effector/effector memory (CD44+/CD62L-) CD8 T cells in the tdLN at day 12 after tumor challenge. E Frequencies (left) and absolute numbers (right) of tumor-infiltrating CD8 T cells at day 12. F Percentage (left) and absolute numbers (right) of tumor-infiltrating CD8 T cells at the endpoint (day 21). G Tumor CD8/Treg ratio at day 21. AG Data from one out of two independent experiments is presented (n = 6 mice per group, per experiment). H, I IFN-γ ELISpot showing the specificities of CD8 T cells under FL/αCD40 therapy, induced by KPctrl tumors and tested for shared peptides (H) or by KPneo tumors and tested for unique neoAgs (I). n = 3, data represent spots from pooled CD8 T cells from 3 mice per group, one out of three independent experiments. Two-way ANOVA followed by Tukey’s post-test in A-G; two-tailed Multiple t-test with Holm-Sidak correction method in (H, I). All data are plotted as mean ± SEM. Source data are provided as a Source Data File.
Fig. 3
Fig. 3. The impact of FL/αCD40 therapy requires Batf3 cDC1.
A, B KPctrl (A) and KPneo (B) were implanted in wild-type or Batf3−/− animals and treated with FL/αCD40 as depicted in 2 A. Tumor outgrowth (n = 4 mice per group). C, D Absolute numbers of tumor-infiltrating CD8 T cells at day 12 (n = 3 mice per group) and 21 (n = 4 mice per group), respectively. E Relative expression of the indicated genes (RT-qPCR) in KPctrl and KPneo tumors tissues upon treatment with FL/αCD40, in WT and Batf3−/− mice. Heatmap showing the z-score of the indicated genes (n = 4). F IFN-γ ELISpot showing the specificities of CD8 T cells to unique peptides, induced by KPneo tumors under DC-therapy in WT and Batf3−/− mice, respectively. n = 3, data represent spots from pooled CD8 T cells from 3 mice per group. Two-way ANOVA followed by Sidak’s post-test in (AC); or Tukey’s post-test in D; two-tailed Multiple t-test with Holm-Sidak correction method in F. All data are plotted as mean ± SEM and represent one out of two independent experiments. Source data are provided as a Source Data File.
Fig. 4
Fig. 4. cDC1 positively correlates with effector CD8 T cells in LUAD across a range of TMB values.
A TMB distribution across lung cancer patients in the TCGA-LUAD PanCancer Atlas dataset. The median value was used to stratify patients as TMB-low or TMB-high. B Correlation between cDC1 and CD8 effector T cell scores. Correlation analysis was performed by two-tailed Pearson correlation coefficient (r). A, B Total number of patients=506; where, TMB-high=253 and TMB-low=252. C Heatmap showing the expression of the cDC1 signature genes across the dataset (z- score average for the indicated genes). cDC1 bottom and top quartiles are highlighted (n = 127 each). D Violin plots showing CD8 effector T cell scores for bottom and top cDC1 quartiles within TMB-low and TMB-high groups. Data represent median (continuous line) and interquartile (dashed lines) (For TMB-low and cDC1 bottom group n = 54, TMB-low and cDC1 top n = 79, TMB-high and cDC1 bottom n = 73, and TMB-high and cDC1 top n = 48). Statistical analysis was performed by two-way ANOVA followed by Tukey’s posttest. E Prognostic values of the cDC1 signature for cancer patient overall survival (on months) comparing bottom and top cDC1 quartiles in the TMB-low and TMB-high groups (TMB-low, n = 127; TMB-high, n = 127). Survival curves were compared using the Log-rank test (Mantel-Cox). Source data are provided as a Source Data File.
Fig. 5
Fig. 5. FL/αCD40 therapy triggers CD8 T cell responses and tumor regression in KPneo lung orthotopic tumors.
A KPctrl and KPneo tumors were implanted orthotopically in the lung and treated as depicted in the scheme. B Quantification of tumor burden 9 days after tumor challenge. Tumor burden was calculated as the ratio between tumor nodules and total lung area (n = 4). C Absolute numbers of cDC1 in tumor-bearing lungs with KPctrl or KPneo tumors upon FL/αCD40 or IgG quantified by FC (n = 4). D Representative tissue cryosections showing localization of cDC1 within KPneo tumor nodules (dotted lines) in XCR1-Venus mice. Representative images from one out of four animals per group, from one independent experiment out of three performed. Scale bars represent 50 µm. E Frequencies (left) and absolute numbers (right) of CD8 T cells in lung tissues were quantified by FC (n = 4). F Representative IHC images of lung tissues labeled with anti-CD8 antibodies, from one out of four animals per group, from one independent experiment out of three performed. Insets depict CD8 T cells infiltrating tumor nodules. Scale bars represent 50 µm. G Quantification of the number of CD8+ cells infiltrating lung nodules showed in (F) (n = 4). H, I Relative frequencies of PD1+ CD8+ T cells (H) and granzyme B (GzmB)-producing CD8 T cells (I) in lungs of animals carrying KPctrl or KPneo tumors, treated with therapy or IgG (n = 4). J Relative frequencies of IFN-γ-producing CD8 T cells in the lungs of the indicated groups were measured after ex-vivo restimulation and ICS (n = 4). Two-way ANOVA followed by Tukey’s post-test in (B, E, G, H, I, J); or Sidak’s post-test in (C). All data are plotted as mean ± SEM, and represent one out of two independent experiments. Source data are provided as a Source Data File.
Fig. 6
Fig. 6. DC therapy relieves exhaustion of CD8+ T cells in lung orthotopic tumors.
Mice were implanted with orthotopic KPneo tumors and treated with FL/αCD40 or IgG, CD45+ cells were isolated from the lungs at day 9 post-tumor challenge and subjected to scRNA-seq. A Dot plot showing scaled gene expression of selected genes defining CD8+ T clusters. B Proportion of CD8 T-cell clusters. C Heatmaps showing log2FC of selected differentially expressed genes (DEG) in FL/αCD40 vs. IgG in C3, C5 and C6 clusters (average log2FC FL/αCD40 vs. IgG FDR < 0.01). D Violin plots show combined mean expression values for the indicated genes (score) for the cytotoxic T cell markers (Gzma, Gzmb, Prf1, Tnf, Ifnγ, Cxcr6) or exhaustion markers (Pdcd1, Ctla4, Tigit, Lag3, Havcr2, Tox, Nrp1) in cells of the indicated clusters in FL/αCD40 vs. IgG. AD scRNAseq data correspond to a pool of 4 animals per group. E Absolute numbers of Ki67+ CD8 T cells evaluated by ICS on KPctrl- and KPneo-bearing lungs (n = 4). F, G Representative FC plots and quantification of the frequencies of TCF-1+PD-1+ (F, n = 4 mice) and Tim3+Lag3+ (G, n = 5 mice) CD8+ T cells. Two-way ANOVA followed by Tukey’s post-test in (E, F, G); two-tailed Mann-Whitney U test in (D). Data are plotted as mean ± SEM, EG represent one out of two independent experiments.
Fig. 7
Fig. 7. DC-therapy induces expansion and functional rescue of cross-presenting cDC1 in lung tissues.
KPneo tumors were implanted orthotopically in the lung and treated with FL/αCD40 or IgG as depicted in 5 A. CD45+ cells were isolated at day 9 after tumor challenge and analyzed by scRNA-seq. A Dot plot showing scaled gene expression of selected genes defining DC clusters. B Heatmap showing the normalized expression of selected genes across different DCs clusters and the association of individual genes to the indicated processes. C Violin plots show combined mean expression values for the indicated genes (score) for the exhaustion markers (Axl, Ccl19, Ccl22, Aldh1) in cells of the indicated clusters in FL/αCD40 vs. IgG. AC scRNAseq data correspond to a pool of 4 animals per group. D Representative FC plots and quantification of the frequencies and absolute numbers of Venus+ cDC1 cells. E Representative FC plots and quantification of the frequencies and absolute numbers of Ki67+ cDC1 cells. F Absolute numbers of IL-12+ cDC1 cells in KPneo treated with FL/αCD40 or IgG. G, H Representative histograms and quantification of PD-L1 or Tim3 expression in cDC1 subsets, respectively. DH For IgG group n = 4 mice, for FL/αCD40 n = 3 mice, one out of two independent experiments. I Scheme describing cross-presentation assay, where sorted cDC1 from KPneo tumor-bearing lungs were pulsed with SIINFEKL ex vivo and co-cultured with CTV-labeled OT-I T cells (Created with BioRender.com). J Representative histograms and quantification of OT-I proliferation. K IFN-γ production by OT-I after 48 h of co-culture. J, K n = 3, data represent experimental replicates from pooled sorted cDC1 from 3 mice per group, per experiment, one out of two independent experiments. two-tailed Mann-Whitney U test in (C); two-tailed Multiple t tests in (DK). Data are plotted as mean ± SEM, represent one out of two independent experiments.

References

    1. Brahmer JR, et al. The Society for Immunotherapy of Cancer consensus statement on immunotherapy for the treatment of non-small cell lung cancer (NSCLC) J. Immunother. Cancer. 2018;6:75. doi: 10.1186/s40425-018-0382-2. - DOI - PMC - PubMed
    1. Remon J, et al. Immune Checkpoint Inhibitors in Thoracic Malignancies: Review of the Existing Evidence by an IASLC Expert Panel and Recommendations. J. Thorac. Oncol. 2020;15:914–947. doi: 10.1016/j.jtho.2020.03.006. - DOI - PubMed
    1. Rizvi NA, et al. Cancer immunology. Mutational landscape determines sensitivity to PD-1 blockade in non-small cell lung cancer. Science. 2015;348:124–128. doi: 10.1126/science.aaa1348. - DOI - PMC - PubMed
    1. Samstein RM, et al. Tumor mutational load predicts survival after immunotherapy across multiple cancer types. Nat. Genet. 2019;51:202–206. doi: 10.1038/s41588-018-0312-8. - DOI - PMC - PubMed
    1. Schoenfeld AJ, Hellmann MD. Acquired Resistance to Immune Checkpoint Inhibitors. Cancer Cell. 2020;37:443–455. doi: 10.1016/j.ccell.2020.03.017. - DOI - PMC - PubMed