. 2024 Mar 13;7(1):318.
doi: 10.1038/s42003-024-05974-4.

Cell-particles interaction - selective uptake and transport of microdiamonds

Affiliations

Cell-particles interaction - selective uptake and transport of microdiamonds

Armin M Ebrahimi et al. Commun Biol. .

Abstract

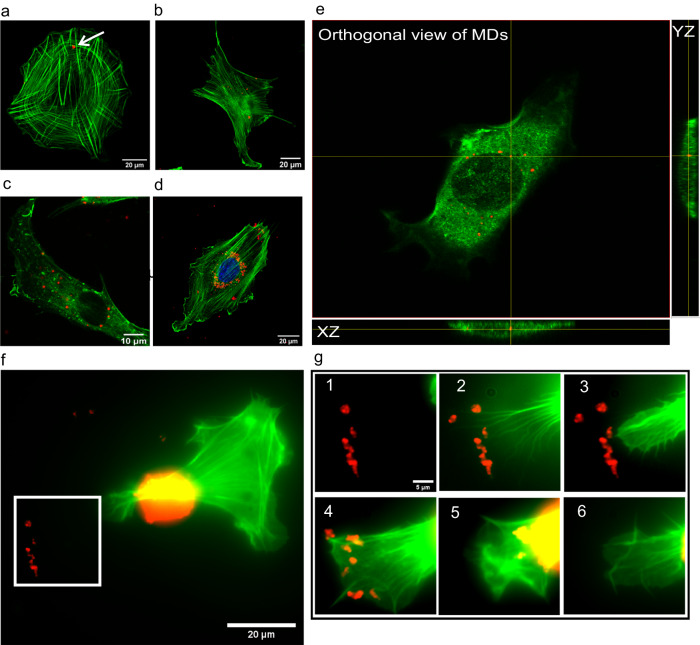
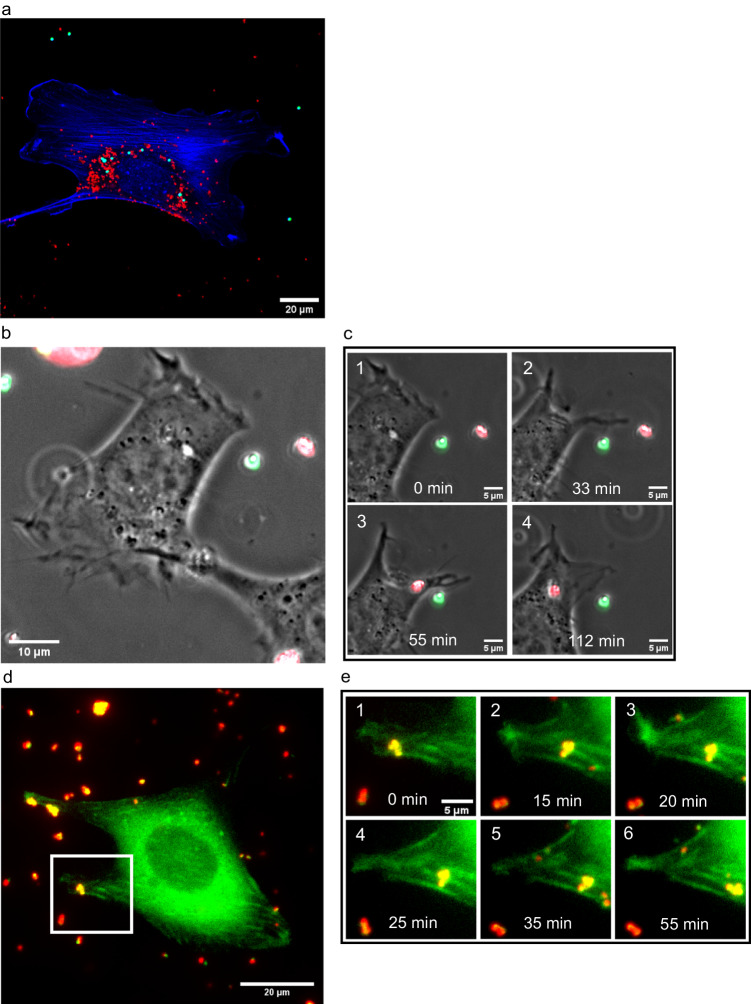
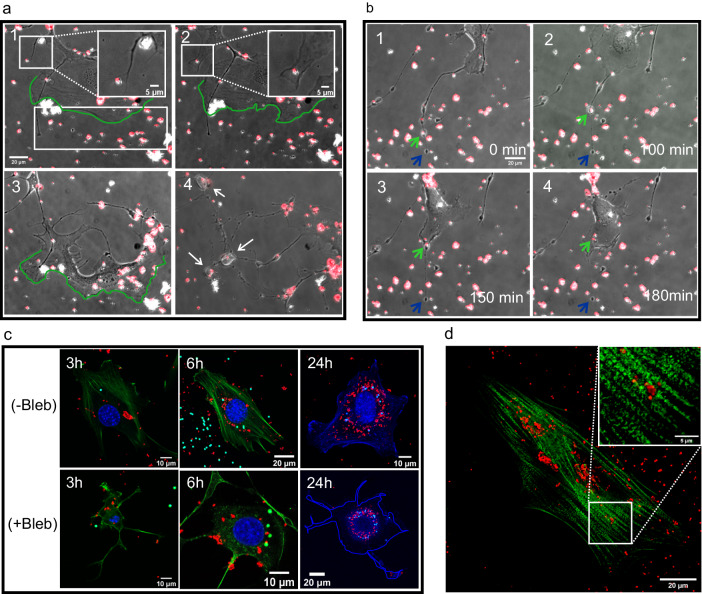
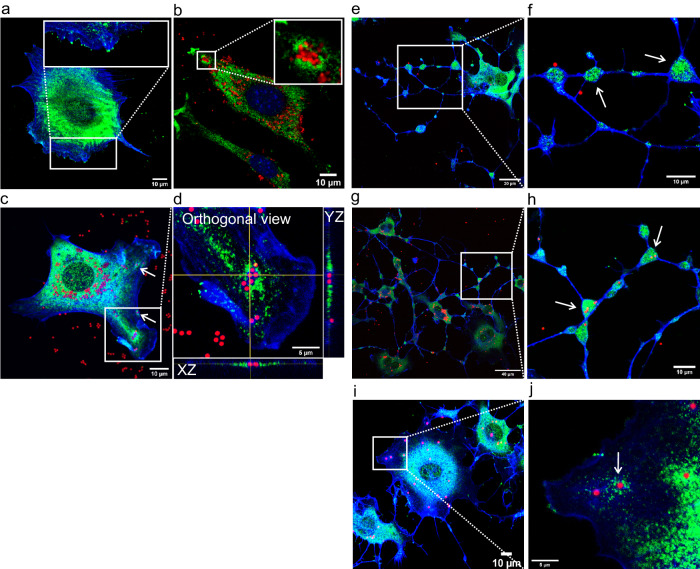
Diamond particles have recently emerged as novel agents in cellular studies because of their superb biocompatibility. Their unique characteristics, including small size and the presence of fluorescent color centers, stimulate many important applications. However, the mechanism of interaction between cells and diamond particles-uptake, transport, and final localization within cells-is not yet fully understood. Herein, we show a novel, to the best of our knowledge, cell behavior wherein cells actively target and uptake diamond particles rather than latex beads from their surroundings, followed by their active transport within cells. Furthermore, we demonstrate that myosin-X is involved in cell-particle interaction, while myosin-II does not participate in particle uptake and transport. These results can have important implications for drug delivery and improve sensing methods that use diamond particles.


Conflict of interest statement

The authors declare no competing interests.

Figures

Fig. 1
Fig. 1. The amount of microdiamonds increases in cells with time.
a Few microdiamonds (MDs) (red) are inside the cell (green) after 0.5 h of incubation. (b), c After 3 and 6 h, the amount of MDs increased with the incubation time. After 24 h (d), most MDs accumulate around the nucleus (blue). e Orthogonal side view of a cell with MDs inside the cell. Replications and number of cases for (ad) are 6 and 45, respectively. f Live transfected cell with EGFP–F-tractin at the beginning of uptake. g Panels 1 to 6 are the time frames of the magnified area, marked as a white square in (f). Panels 1 and 2 show how the cell finds MDs employing protrusions: the cell extends the protrusions and creates lamellipodia to probe the particles (3,4). Finally, it is displayed in (5,6) that how the cell uptakes the particles inside. This process happens 16 h after adding the particles, and the time interval between images is 15 min. Replications and number of cases for (fg) are 3 and 15, respectively.
Fig. 2
Fig. 2. Cells selectively uptake microdiamonds than latex beads, and actively transport particles through actin filaments.
a Cells with both microdiamonds (MDs) (red) and latex beads (LBs) (green) after 24 h of incubation, fixed and stained for nucleus and actin (both in blue), show more MDs than LBs inside the cells around the nucleus. Replications and number of cases are 4 and 70, respectively. b Full field of view of the cell at the beginning of uptake. c Time frames of the uptake of the MD by the cell which starts 1 h after adding particles to the sample show that the cell extends the protrusion to the MD to uptake it while leaving the LB outside the cell. In c (2), the cell is connected to the LB by protrusion, but it does not lead to the uptake of this particle. Replications and number of cases for (b–c) are 4 and 14, respectively. The results of selective uptake have been taken from a full field of view (300*300 µm),  one example can be seen in the Supplementary Fig. 4. d Full field of view of the investigated live cell transfected with EGFP-F-tractin and MDs deposited around it. e (1–6) The time frames of the cropped area marked in (d) show that the cells transport the MDs along the actin fiber; this process started 50 min after adding the particles. Replications and number of cases for (de) are 3 and 7, respectively.
Fig. 3
Fig. 3. The processes of uptake and accumulation of particles around cell nucleus do not change when the activity of myosin-II is inhibited.
(a) (1,2) Example of cells 2.5 and 3 h after Blebbistatin (Bleb) treatment. The cell uses the protrusions to find the microdiamonds (MDs) (red) on the dish surface. After 3 h, the cell extends the protrusion and forms lamellipodia to uptake MD inside. Further, there are MD particles attached to the dish surface as shown in the selected area (white rectangle) next to the cell membrane, outlined in green. After 8 h (3), the cell follows and reaches for MDs on the dish surface and finally probes that area and uptakes all of them by the active edge (green edge). In a (4), after 16 h, the same cell created many tails and vesicles, which are visible in the image. Interestingly, there are MDs present in those vesicles, as pointed to by white arrows. b Time frames of (1–4) show MDs located in the moving vesicles along the cell tail, entering the cell. The entire process takes 3 h and starts 2.5 h after adding Bleb. The movement of the vesicle together with the MDs is indicated by a green arrow. Finally, in b (4), the MD enters the cell. The tail has a fixed length throughout the process, and the end of the tail is shown by a blue arrow. Replications and number of cases for (a and b) are 3 and 27, respectively. c Fixed and stained cells with and without Bleb treatment after 3, 6, and 24 h of incubation. In both samples, the amount of MDs is larger than that of latex beads (LBs), but the amount of both particles does not change drastically in the Bleb-treated and normal cells. Finally, in the sample after 24 h, both MDs and LBs accumulate around the nucleus. (3, 6 h upper and lower panels: MDs in red, actin in green, LBs in cyan, nucleus in blue) and (24 h upper panel: MDs in red, actin and nucleus in blue, LBs in cyan –lower panel 24 h: MDs in red, LBs in green, artificially added cell edge in blue). Replications and number of cases are 3 and 55, respectively. d Cells incubated with MDs for 12 h were fixed and stained for myosin-II. The results indicate that myosin-II does not accumulate around particles, and it is distributed inside the cell similarly to control cells without particles and that myosin-II is distributed along actin fibers as we can see in Supplementary Fig. 6c-d. Replications and number of cases are 3 and 46, respectively.
Fig. 4
Fig. 4. Myosin-X accumulates around the particles within normal and Bleb-treated cells.
a Control cell without particles and without myosin-II inhibition, stained for myosin-X (green) and actin (blue) shows a normal distribution of myosin-X protein in the cell and at the tips of filopodia. b Results of untreated cells incubated with microdiamond particles (MDs) (red). There is accumulation of myosin-X around MDs inside the cell. Replications and number of cases for (a, b) are 7 and 34, respectively. c Myosin-X accumulates around latex beads (LBs) (red) inside the untreated cell. There is a higher accumulation of myosin-X around a cluster of six particles than around two or a single particle. d An orthogonal view of (c) shows the aggregation of myosin-X around the particles in both the xz and yz directions. Replications and number of cases for (c, d) are 3 and 7, respectively. (e) and (g) Bleb-treated cells show myosin-X in the vesicles (white arrows in f and h) along the cell tails after treatment for 6 h and 24 h, respectively. i, j Accumulation of myosin-X around the particles in cells after 6 h of treatment with Bleb. Replications and number of cases for (e–j) are 3 and 34, respectively.
Fig. 5
Fig. 5. Myosin-X shows a colocalization with microtubules in the areas where particles are present.
a Cross-staining for actin (blue), microtubules (MTs) (red), and myosin-X (green) in cells incubated for 24 h with non-fluorescent microdiamonds (MDs). Myosin-X is mostly localized with the MT in areas where there are MDs. Separated channels of this panel can be seen in Supplementary Fig. 12. b The cropped part of (a) shows that myosin-X is localized with MTs-rich areas, and not with actin reach areas (as shown by dashed lines). Replications and number of cases for (a, b) are 4 and 33, respectively. c The control sample without particles with the same staining shows no colocalization between the MT and myosin-X in the cell in the center of the image. d Evaluation of the accumulation of myosin-X (green) around latex beads (LBs) (blue) in four selected areas with microtubules (MT) (red) shows that in three areas, there is myosin-X around visible LBs inside the cell but shows no myosin-X in the last area without particles. e In the magnification of the four areas of image d for different imaging channels, the amount of myosin-X is smaller around one particle in area 3 than in area 1, which contains five particles. Interestingly, the amount of myosin-X is significantly reduced in area 4, even with the denser MT but without beads. Separated channels of panel d can be seen in Supplementary Fig. 13 where we can see myosin-X tracks along MT. Replications and number of cases for (d, e) are 3 and 10, respectively. f and g The control sample with the same staining as image d does not show any accumulation or colocalization of myosin-X and the MT without the presence of particles.
Fig. 6
Fig. 6. Myosin-X and EEA1 show colocalization around particles inside the cells.
a Control staining of cells with EEA1 (red) and myosin-X (green) shows no accumulation or colocalization between these two proteins. b After 6 h of incubation of cells with microdiamonds (MDs) (green), the cells fixed and stained for EEA1 and actin (blue) show endosomes around MDs. c Cells after 12 h of incubation with non-fluorescent MDs fixed and stained for EEA1 (red) and myosin-X (green) show an accumulation of both proteins around MDs. The white arrows indicate other MDs inside the cell, in which there is no separate accumulation of any of the two proteins. This result suggests a functional relationship between myosin-X and EEA1. d The magnified selected area in c shows a dense accumulation of myosin-X and EEA1 around MDs. Replications and number of cases for (b–d) are 4 and 33, respectively.

References

    1. Basso L, Cazzanelli M, Orlandi M, Miotello A. Nanodiamonds: Synthesis and Application in Sensing, Catalysis, and the Possible Connection with Some Processes Occurring in Space. NATO Adv. Sci. Inst. Ser. E Appl. Sci. 2020;10:4094.
    1. Ansari SA, et al. Role of Nanodiamonds in Drug Delivery and Stem Cell Therapy. Iran. J. Biotechnol. 2016;14:130–141. doi: 10.15171/ijb.1320. - DOI - PMC - PubMed
    1. Mengesha, A. E. & Youan, B.-B. C. 8 - Nanodiamonds for drug delivery systems. in Diamond-Based Materials for Biomedical Applications (ed. Narayan, R.) 186–205 (Woodhead Publishing, 2013).
    1. Wu Y, Weil T. Recent Developments of Nanodiamond Quantum Sensors for Biological Applications. Adv. Sci. 2022;9:e2200059. doi: 10.1002/advs.202200059. - DOI - PMC - PubMed
    1. Chipaux M, et al. Nanodiamonds and Their Applications in Cells. Small. 2018;14:e1704263. doi: 10.1002/smll.201704263. - DOI - PubMed

Publication types