. 2024 Jul;45(7):1506-1519.
doi: 10.1038/s41401-024-01233-8. Epub 2024 Mar 13.

Clobetasol propionate, a Nrf-2 inhibitor, sensitizes human lung cancer cells to radiation-induced killing via mitochondrial ROS-dependent ferroptosis

Affiliations

Clobetasol propionate, a Nrf-2 inhibitor, sensitizes human lung cancer cells to radiation-induced killing via mitochondrial ROS-dependent ferroptosis

Archita Rai et al. Acta Pharmacol Sin. 2024 Jul.

Abstract

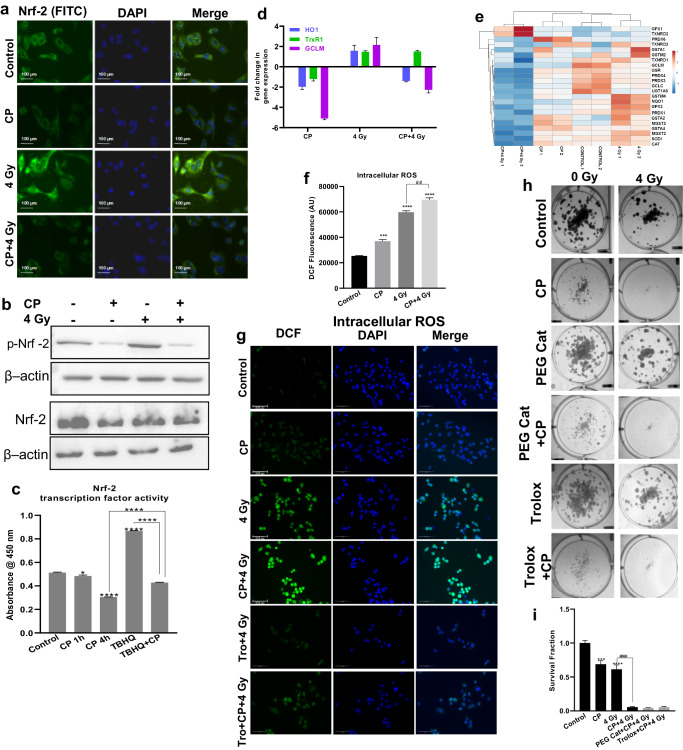
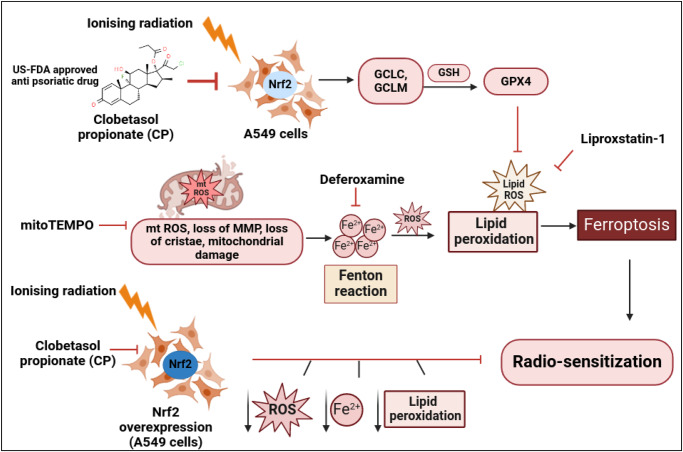
Combining radiotherapy with Nrf-2 inhibitor holds promise as a potential therapeutic strategy for radioresistant lung cancer. Here, the radiosensitizing efficacy of a synthetic glucocorticoid clobetasol propionate (CP) in A549 human lung cancer cells was evaluated. CP exhibited potent radiosensitization in lung cancer cells via inhibition of Nrf-2 pathway, leading to elevation of oxidative stress. Transcriptomic studies revealed significant modulation of pathways related to ferroptosis, fatty acid and glutathione metabolism. Consistent with these findings, CP treatment followed by radiation exposure showed characteristic features of ferroptosis in terms of mitochondrial swelling, rupture and loss of cristae. Ferroptosis is a form of regulated cell death triggered by iron-dependent ROS accumulation and lipid peroxidation. In combination with radiation, CP showed enhanced iron release, mitochondrial ROS, and lipid peroxidation, indicating ferroptosis induction. Further, iron chelation, inhibition of lipid peroxidation or scavenging mitochondrial ROS prevented CP-mediated radiosensitization. Nrf-2 negatively regulates ferroptosis through upregulation of antioxidant defense and iron homeostasis. Interestingly, Nrf-2 overexpressing A549 cells were refractory to CP-mediated ferroptosis induction and radiosensitization. Thus, this study identified anti-psoriatic drug clobetasol propionate can be repurposed as a promising radiosensitizer for Keap-1 mutant lung cancers.

Keywords: clobetasol propionate; glucocorticoid; iron homeostasis; lipid peroxidation; non-small cell lung carcinoma; radiosensitization.


Conflict of interest statement

The authors declare no competing interests.

Figures

Fig. 1
Fig. 1. Clobetasol propionate enhanced radiosensitivity of human lung cancer cells.
The graph shows relative luminescence measured by cell titre ATP glo assay (a). Hypodiploid cells were enumerated by sub-G1 analysis after propidium iodide staining. Overlaid flow cytometric histogram is shown in the inset and percent cell death is graphed in b. Vehicle or CP-treated, unirradiated or irradiated cells were cultured for 60–70 h and imaged at 8 h intervals in IncuCyte live cell imaging. Representative images are shown in c and the phase area confluence normalized to the initial time point is shown in d. The scale bar represents 800 µm in Fig. 1c. Representative images of colonies formed are shown in e, and the bar graph showing the survival fraction is shown in f. Percent side population is graphed in (g). Representative images of A549 spheroids and PI uptake by spheroids are shown in h and the bar graph representing the PI intensity of the respective spheroids is shown in i. The scale bar represents 75 µm in Fig. 1h. Data are presented as mean ± SEM (n = 3) and three such independent experiments were carried out. P value is indicated as follows: * Represents comparison with control such that *P < 0.05, **P < 0.01, ***P < 0.001 and ****P < 0.0001. Similarly, # represents comparison with 4 Gy group and #P < 0.05, ###P < 0.001 and ####P < 0.0001.
Fig. 2
Fig. 2. Clobetasol propionate induced oxidative stress via inhibition of Nrf-2.
Cells were stained with anti-Nrf-2 mAb (green) and counterstained using DAPI (blue) with antifade. Cells were imaged under a fluorescence microscope and, representative images are shown in (a). The scale bar in Fig. 2a represents 100 µm. Cells were lysed and probed for p-Nrf-2, Nrf-2 and β-actin by Western blotting (b). Vehicle or CP treated, unirradiated or irradiated cells, TBHQ (50 µM, 16 h) and TBHQ + CP (4 h) treated cells were processed for nuclear extract preparation followed by Nrf-2 transcription factor activity assay. Relative Nrf-2 activity is shown in c. HO1, GCLM & TrxR1 mRNA levels were quantified using qRT-PCR after normalization with GAPDH and fold change in gene expression is shown in d. Heatmap generated using ClustVis, representing modulation of antioxidant genes regulated by Nrf-2 as assessed by transcriptomics conducted for control, CP, 4 Gy and CP + 4 Gy treated cells for 24 h, in duplicates is shown in e. Cells were monitored for DCF fluorescence. The bar graph shows relative DCF fluorescence in vehicle or CP treated, unirradiated or irradiated cells is shown in (f). Representative images of the DCF stained, vehicle, CP, trolox or trolox+CP treated, unirradiated or irradiated cells are shown in g. The scale bar represents 100 µm in Fig. 2g. In another experiment, DCF-stained cells were treated with PEGylated catalase or trolox prior to CP treatment. Cells were treated with trolox or PEG-catalase prior to CP treatment and exposed to 4 Gy dose of radiation. Cells were allowed to form colonies, and representative images of the colonies are shown in h. The bar graph denoting respective survival fractions is shown in i. Data are presented as mean ± SEM. (n = 3), and three such independent experiments were carried out. P value is indicated as follows: * Represents comparison with control such that *P < 0.05, ***P < 0.001 and ****P < 0.0001. Similarly, # represents a comparison with the 4 Gy group and ##P < 0.01, ###P < 0.001.
Fig. 3
Fig. 3. CP treatment resulted in increased DNA damage when combined with radiation.
Gene set enrichment analysis of biological processes analysis of RNA-seq data obtained from cells treated with CP + 4 Gy (a). Gene ontology cellular component analysis of RNA-seq data of cells treated with CP + 4 Gy (b). Analysis of biological processes as studied by gene ontology analysis of cells treated with CP alone (c) and a combination of CP + 4 Gy (d). Representative immunofluorescence images of cells showing γH2AX foci (green) in the nucleus (blue) are shown in e, 53BP1 foci (green) in the nucleus (blue) is shown in g, and the bar graph representing the number of γH2AX foci per cell or the number of 53BP1 foci per cell is shown in f and h respectively. Each data point in the graph represents mean ± SEM. from 50 cells per group and two such independent experiments were carried out. * Represents comparison with control such that, ****P < 0.0001. Similarly, # represents comparison with the 4 Gy group and #P < 0.05, ##P < 0.01, and ###P < 0.001.
Fig. 4
Fig. 4. Clobetasol propionate impaired mitochondrial health and function when combined with radiation.
The bar graph showing MitoSOX Red fluorescence of cells treated with CP, 4 Gy and CP + 4 Gy by flow cytometry is shown in a and histogram has been included in the inset of a. Cells were stained with JC-1 and the change in mitochondrial membrane potential is calculated as the ratio of red/green fluorescence shown in b. Cells were processed for ultrastructural analysis using TEM. Intracellular vacuoles and mitochondria are indicated by black and red arrows, respectively (c). The bar graph representing the number of vacuoles per cell is shown in d and the mitochondrial circularity index is shown in e. Data are presented as mean ± S.E.M. (n = 3), and three such independent experiments were carried out for a and b, and two independent experiments were carried out for (c-e). * Represents comparison with control such that *P < 0.05, **P < 0.01, ***P < 0.001 and ****P < 0.0001. Similarly, # represents comparison with the 4 Gy group and ####P < 0.0001.
Fig. 5
Fig. 5. Clobetasol propionate induced ferroptosis in lung cancer cells exposed to radiation.
Cells were assessed for iron levels using a selective turn-on fluorescence sensor probe (green). Representative images showing labile iron pool (green) are shown in a. The scale bar in the bottom left represents 100 µm in Fig. 5a. The bar graph showing the ratio of red/green fluorescence indicating lipid peroxidation is shown in b. KEGG pathway analysis of gene ontology using RNA-seq data of cells treated with CP + 4 Gy (c). Heatmap generated via ClustVis using RNA-seq data representing modulation of genes involved in ferroptosis pathways is shown in d. Overlaid flow cytometric histogram is shown in e. Percent cell death is graphed in f. Representative images of colonies are shown in g, and a bar graph denoting their respective survival fractions is shown in h. Cells were processed to assess the protein levels of GPX4 and ACSL4 using a flow cytometer. The corresponding bar graph is shown in i and j. Data are presented as mean ± SEM. (n = 3), and three independent experiments were carried out for a, b, e, g, and two independent experiments were carried out for i and j). * Represents comparison with control such that **P < 0.01, ***P < 0.001 and ****P < 0.0001. Similarly, # represents comparison with the 4 Gy group and ##P < 0.01, and ####P < 0.0001. $ Represents comparison with any other group and $$$$P < 0.0001.
Fig. 6
Fig. 6. Radiosensitization by clobetasol propionate is dependent on mitochondrial ROS.
Cells were stained with a selective turn-on fluorescence sensor probe. Representative images of labile iron levels in cells are shown in a. The scale bar at the bottom left represents 200 µm in Fig. 6a. Representative images indicating MSR fluorescence are shown in b. Scale bar at the bottom right represents 50 µm in Fig. 6b. The bar graph denoting levels of mitochondrial ROS by MSR staining is shown in c. Representative images of colonies in which cells were pre-treated with mitoTEMPO are shown in d and a bar graph showing survival fraction is shown in e. Data are presented as mean ± SEM. (n = 3), and three such independent experiments were carried out. * Represents comparison with control such that **P < 0.01 and ****P < 0.0001. Similarly, # represents comparison with the 4 Gy group and ###P < 0.001. $Represents comparison with any other group and $$P < 0.01, $$$P < 0.001 and $$$$P < 0.0001.
Fig. 7
Fig. 7. Role of Nrf-2 in ferroptosis mediated radiosensitization.
Representative images of labile iron levels in cells along with the Nrf-2 Overexpression group are shown in a. The scale bar at the bottom left represents 200 µm in a. The bar graph showing levels of mitochondrial ROS by MSR is shown in b. Ratio of red to green fluorescence is shown in c. Cells treated as above were cultured for two weeks for colony formation. Representative images of colonies are shown in d. A bar graph denoting the survival fraction is shown in e. Data are presented as mean ± SEM. (n = 3), and three such independent experiments were carried out. Mice implanted with A549 cells were administered with vehicle or clobetasol propionate followed by exposure to radiation or left unirradiated. The bar graph of tumor volume on Day 21 is shown in f. Data are presented as mean ± SEM for a total of nine animals (n = 9) pooled from two independent experiments. Nrf-2 overexpression is denoted by Nrf-2 OE. * Represents comparison with control such that *P < 0.05, **P < 0.01, ***P < 0.001 and ****P 0.0001. Similarly, # represents comparison with the 4 Gy group and #P < 0.05 and ###P < 0.001. $ Represents comparison with any other group and $P < 0.05, $$P < 0.01, and $$$$P < 0.0001.
Scheme 1
Scheme 1. Clobetasol propionate induces radiosensitization of human lung cancer cells via ferroptosis.
In combination with radiation, CP showed enhanced iron release, mitochondrial ROS, and lipid peroxidation, indicating ferroptosis induction. Further, iron chelation, inhibition of lipid peroxidation or scavenging mitochondrial ROS prevented CP-mediated radiosensitization. Interestingly, Nrf-2 overexpressing A549 cells were refractory to CP-mediated ferroptosis induction and radiosensitization.

References

    1. Thandra KC, Barsouk A, Saginala K, Aluru JS, Barsouk A. Epidemiology of lung cancer. Contemp Oncol. 2021;25:45–52. - PMC - PubMed
    1. Uzel EK, Figen M, Uzel Ö. Radiotherapy in lung cancer: current and future role. Sisli Etfal Hastan Tip Bul. 2019;53:353–60. doi: 10.14744/SEMB.2019.25991. - DOI - PMC - PubMed
    1. Aravindan N, Aravindan S, Pandian V, Khan FH, Ramraj SK, Natt P, et al. Acquired tumor cell radiation resistance at the treatment site is mediated through radiation-orchestrated intercellular communication. Int J Radiat Oncol Biol Phys. 2014;88:677–85. doi: 10.1016/j.ijrobp.2013.11.215. - DOI - PMC - PubMed
    1. Césaire M, Montanari J, Curcio H, Lerouge D, Gervais R, Demontrond P, et al. Radioresistance of non-small cell lung cancers and therapeutic perspectives. Cancers. 2022;14:2829. doi: 10.3390/cancers14122829. - DOI - PMC - PubMed
    1. Liu YP, Zheng CC, Huang YN, He ML, Xu WW, Li B. Molecular mechanisms of chemo‐and radiotherapy resistance and the potential implications for cancer treatment. MedComm. 2021;2:315–40. doi: 10.1002/mco2.55. - DOI - PMC - PubMed

MeSH terms